Legacy Grafana Dashboards (v1)
These dashboards are legacy. They keep working but are frozen: new indicators and features only land in Org Monitoring by sfdx-hardis (Dashboards v2), which adds fleet overview, trends and averages, limit forecasts, org health score, drill-down navigation and a ready-to-enable alert pack. Use v2 for any new setup.
The v1 set uses its own Grafana folder, UIDs and JSON files, so it can coexist with v2 during a transition.
Prerequisite: the Grafana / API integration setup (Loki + Prometheus endpoints configured on the monitoring repository).
Download legacy v1 dashboards
Download all legacy Dashboard JSON files from this sfdx-hardis repo folder

Create Dashboard folder
Go to the Dashboards menu, then click New and New folder
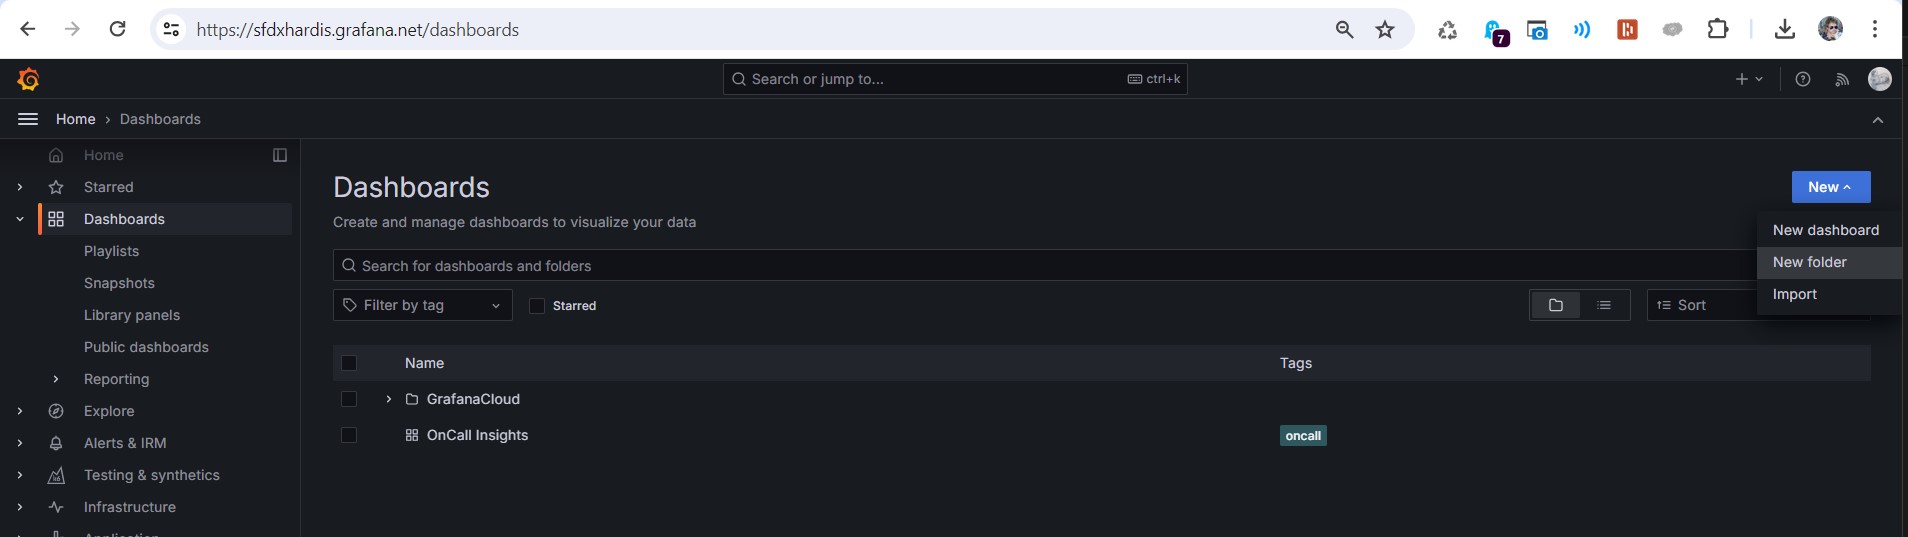
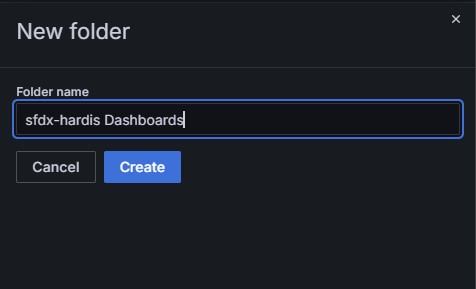
Create folder Sfdx-hardis Dashboards
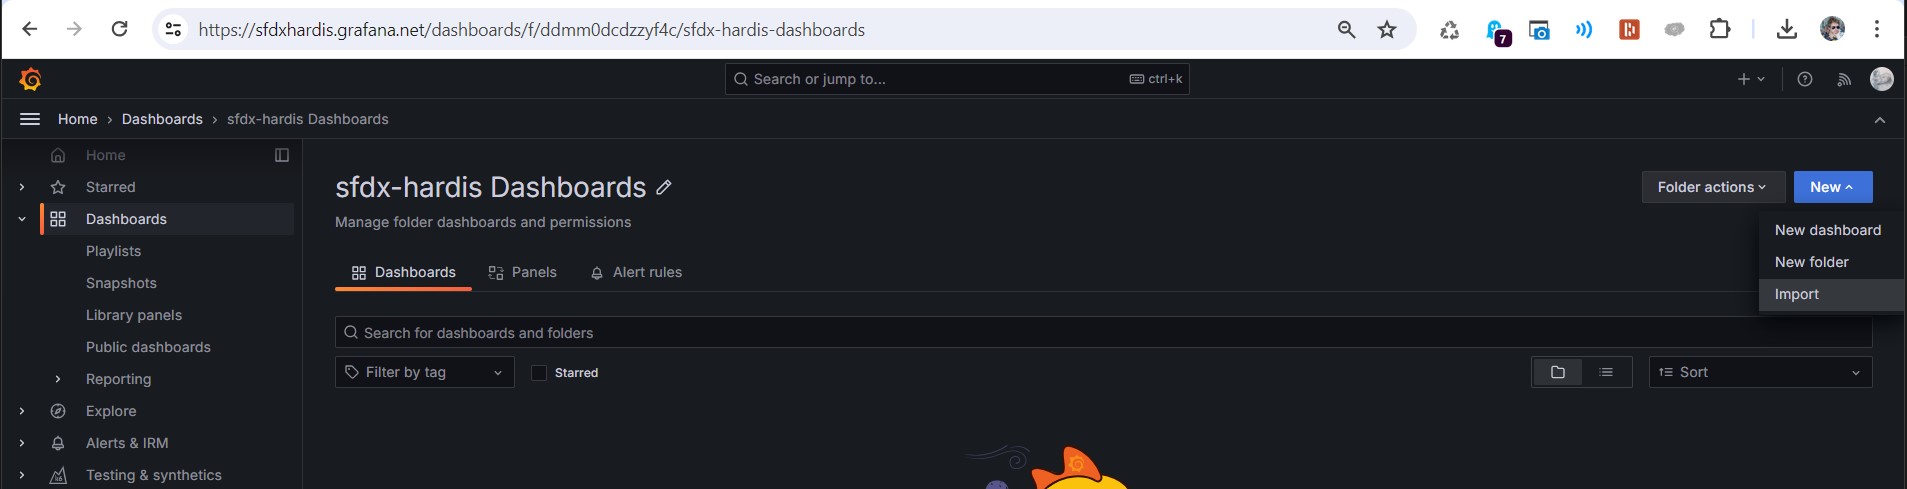
Import legacy v1 Grafana Dashboards
For each downloaded Dashboard JSON file, perform the following actions.
Click New then Import
Click on Upload Dashboard JSON File and select one of the Dashboards JSON files you downloaded on your computer.

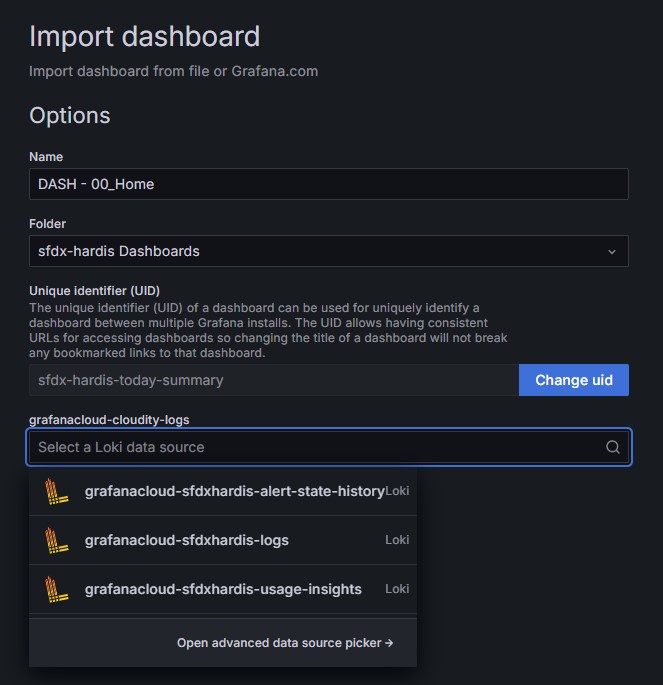
- Leave the default values for Name, Folder and UID
- Select your Loki or Prometheus source. They can be:
- grafanacloud-YOURORGNAME-logs (Loki)
- grafanacloud-YOURORGNAME-prom (Prometheus)
Click Import
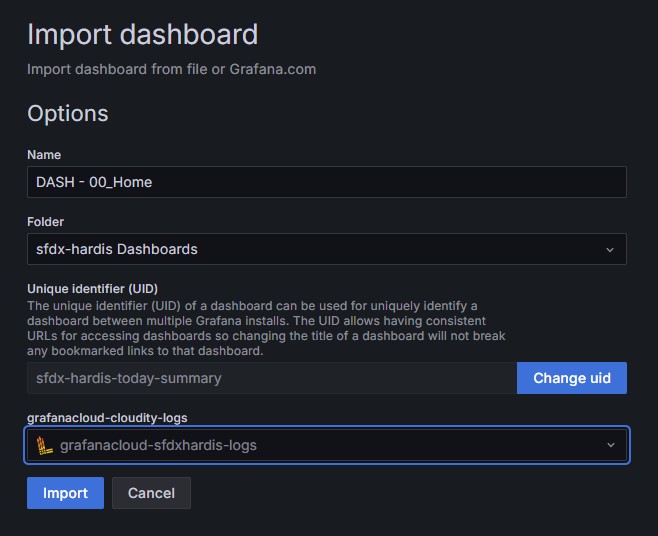
Repeat the operation for all Dashboard JSON files, and you're all set.
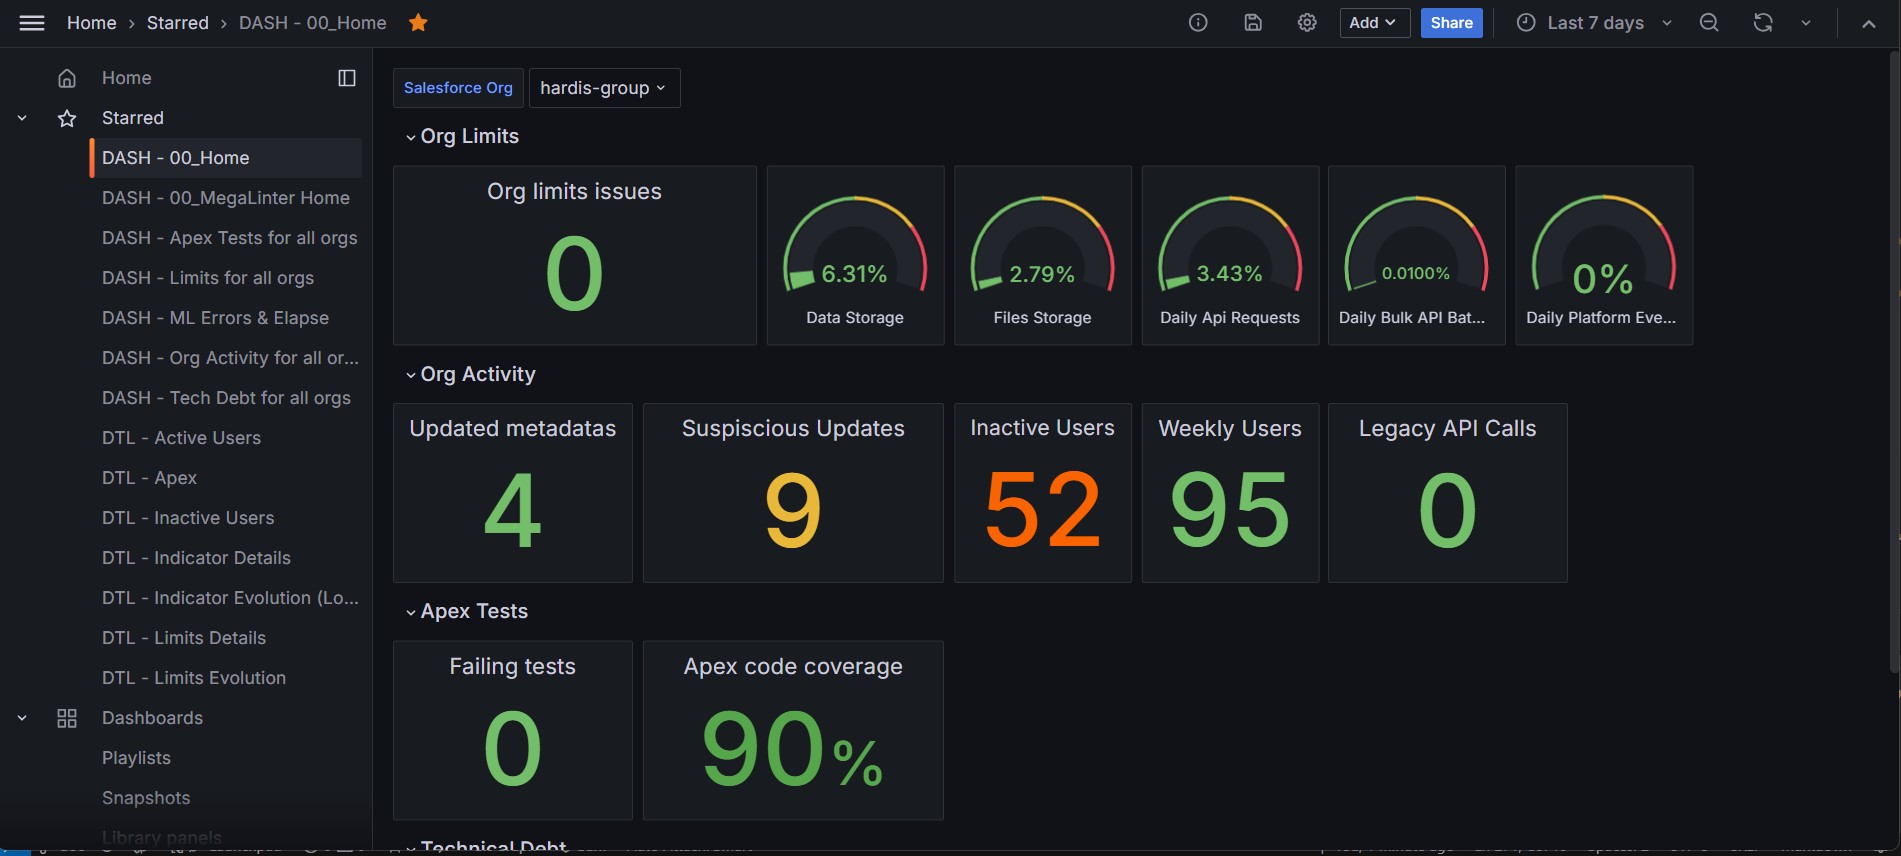
Migrating to v2
Import the v2 dashboards in a new folder by following the v2 guide: no change is needed on the monitoring pipeline side (same Loki and Prometheus data). Once your team has switched its bookmarks, delete the v1 folder in Grafana.