Monitoring home
Salesforce Org Monitoring
Keep a daily, version-tracked backup of every metadata in your Salesforce orgs, with before/after diffs, quality and security checks, and notifications routed where your team actually reads them.
"This feature worked yesterday in production, but today it crashes. What happened?" Sfdx-hardis Monitoring answers that question in seconds.
Why monitor your orgs?
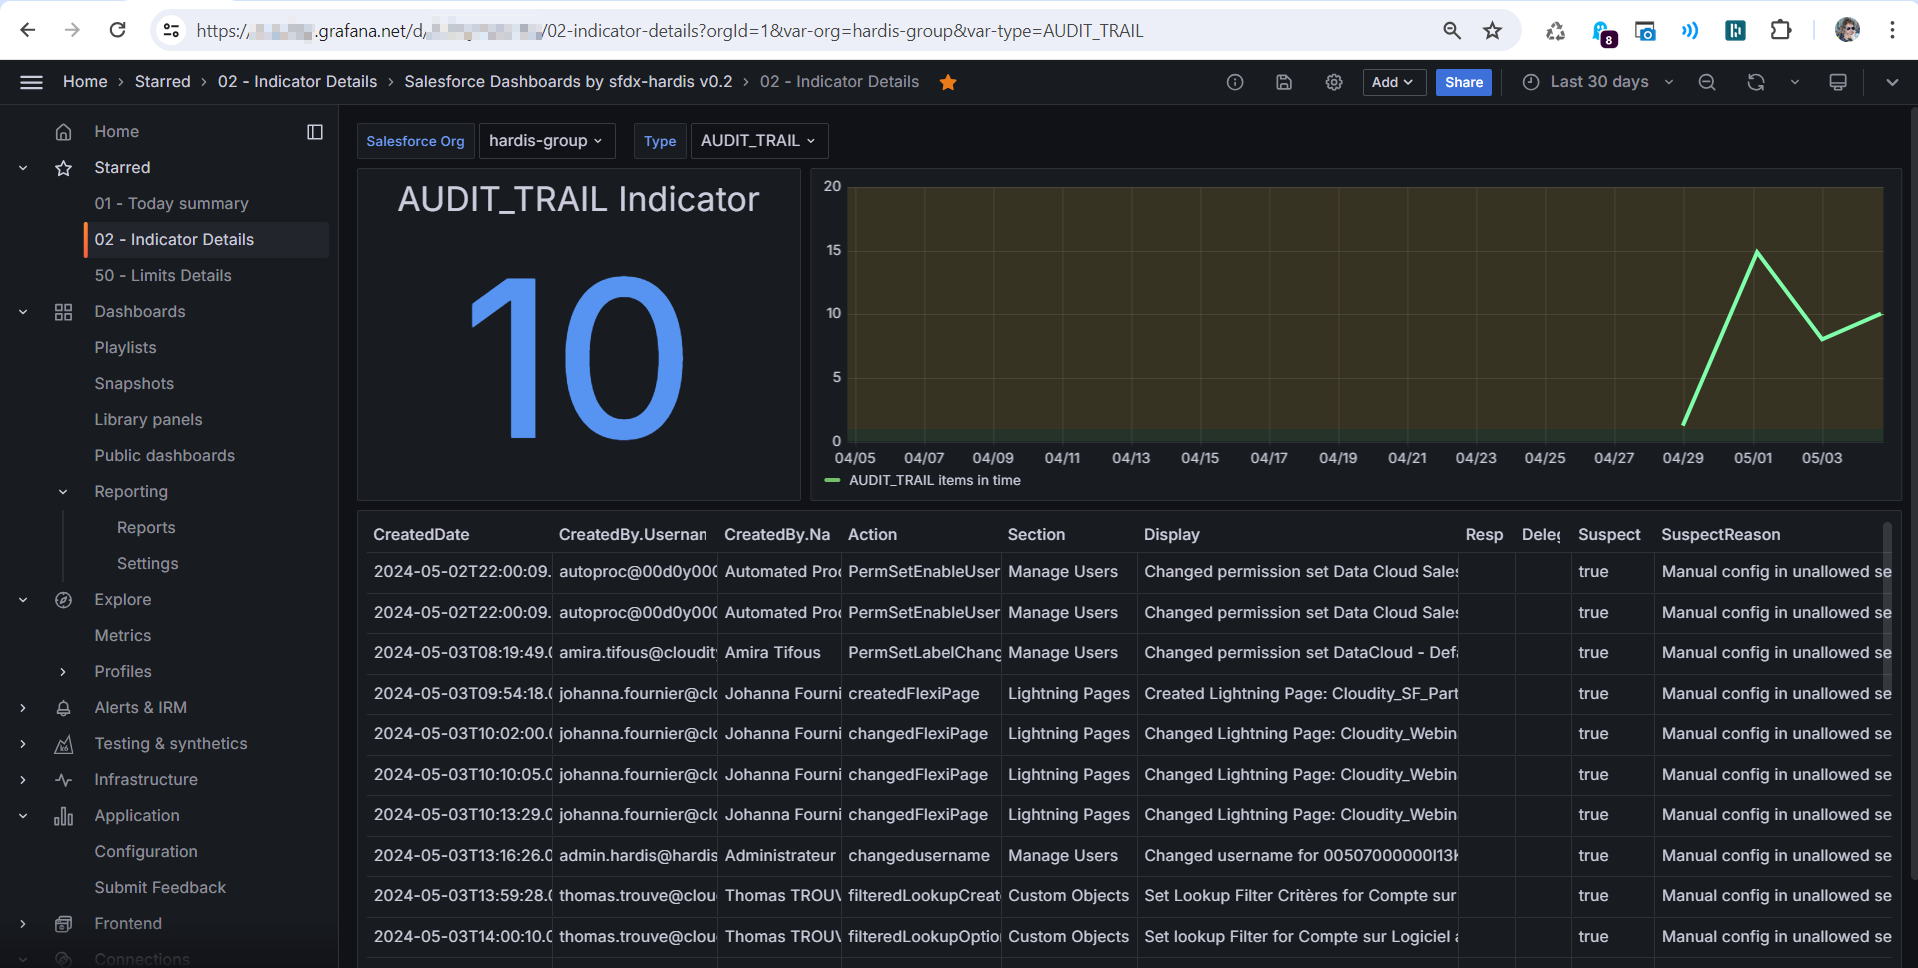
- See exactly what changed: Salesforce Audit Trail tells you who updated what, but not the before/after. A git-based metadata backup gives you the full picture.
- Catch problems early: failing Apex tests, security issues, deprecated API calls, org limits, overdue Release Updates are all surfaced automatically.
- Stay admin-friendly: works on any API-enabled org. No CI/CD project required.
- Route the right signal to the right channel: stream everything to Grafana while keeping Slack and Teams reserved for warnings and errors only.
What gets monitored
Configuration changes
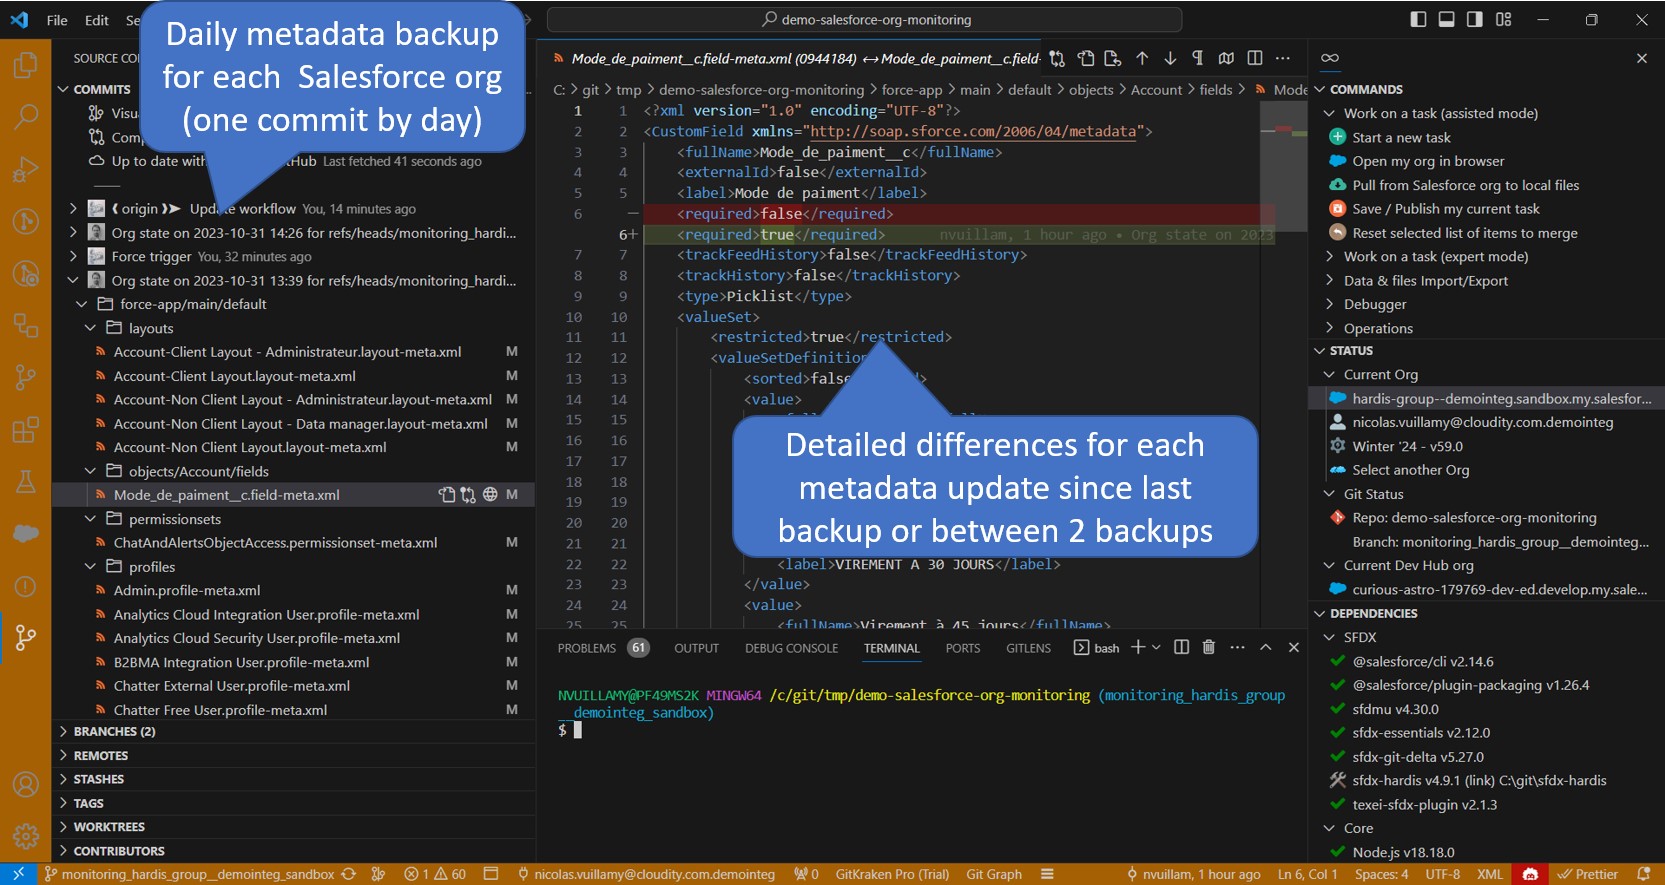
- Daily metadata backup with full git history
- Detection of suspect setup actions in Audit Trail
- Visual diff of every change between two backups
Quality and security
- Apex tests (and soon Flow tests)
- Code quality and security analysis with MegaLinter
- Salesforce Security Health Check
- Unsecured Connected Apps
Org health
- Org limits and Apex flex queue backlog
- Apex and Flow runtime errors
- Calls to deprecated API versions
- Metadata deployments and validations
- Next major Salesforce upgrade date and incoming Release Updates
Users and licenses
- License usage and unused permission set licenses
- Active users without recent logins
- Underused or minimal permission sets
Unused metadata
- Custom labels, custom permissions, Apex classes, Connected Apps, inactive metadata
- Missing descriptions on custom fields
- Custom elements with no access rights in any permission set
Custom checks
- Your own custom command lines defined in
.sfdx-hardis.yml
A look inside
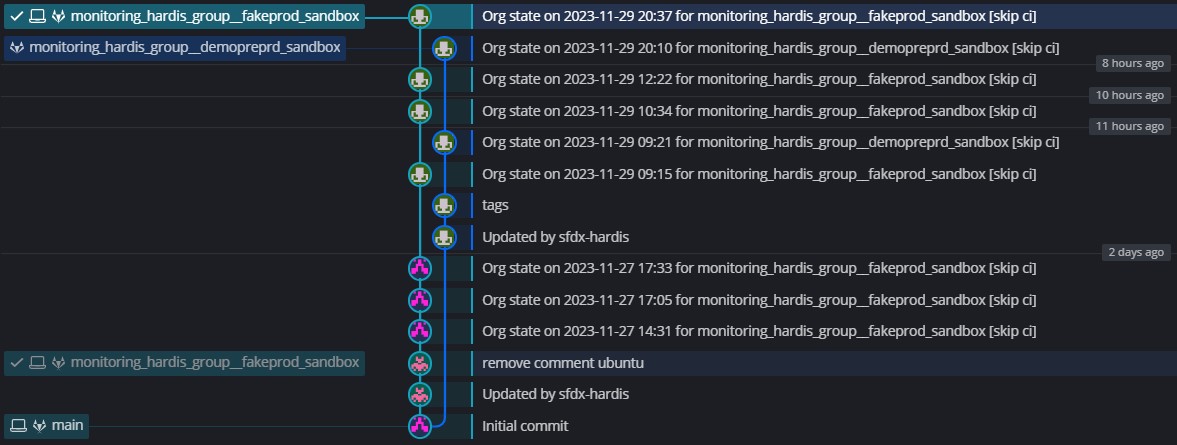
Browse the monitoring git repository to see every metadata change, commit by commit.
Inspect diffs with GitLens to see exactly what was added, removed, or modified.
Build dashboards in Grafana to track trends across all your orgs.


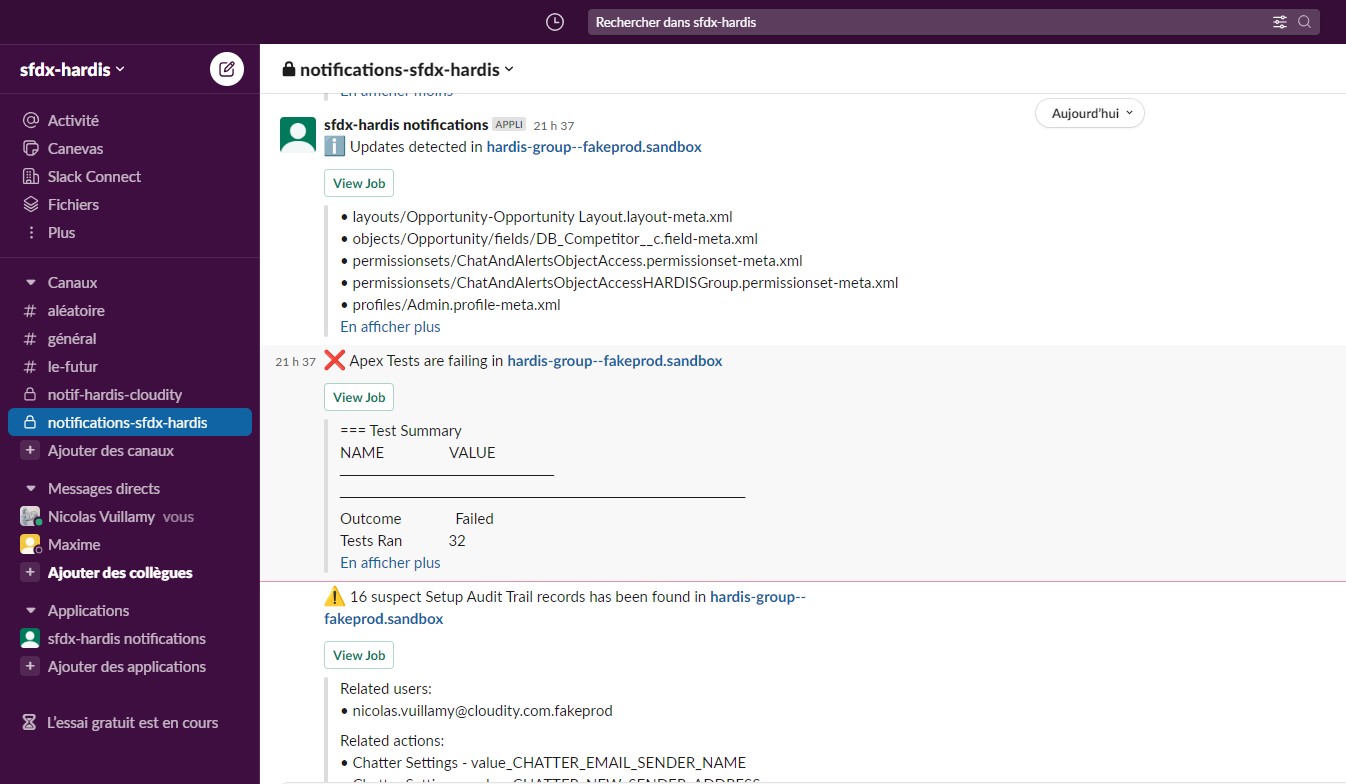
Get Slack or Teams notifications when something needs attention.
How it works
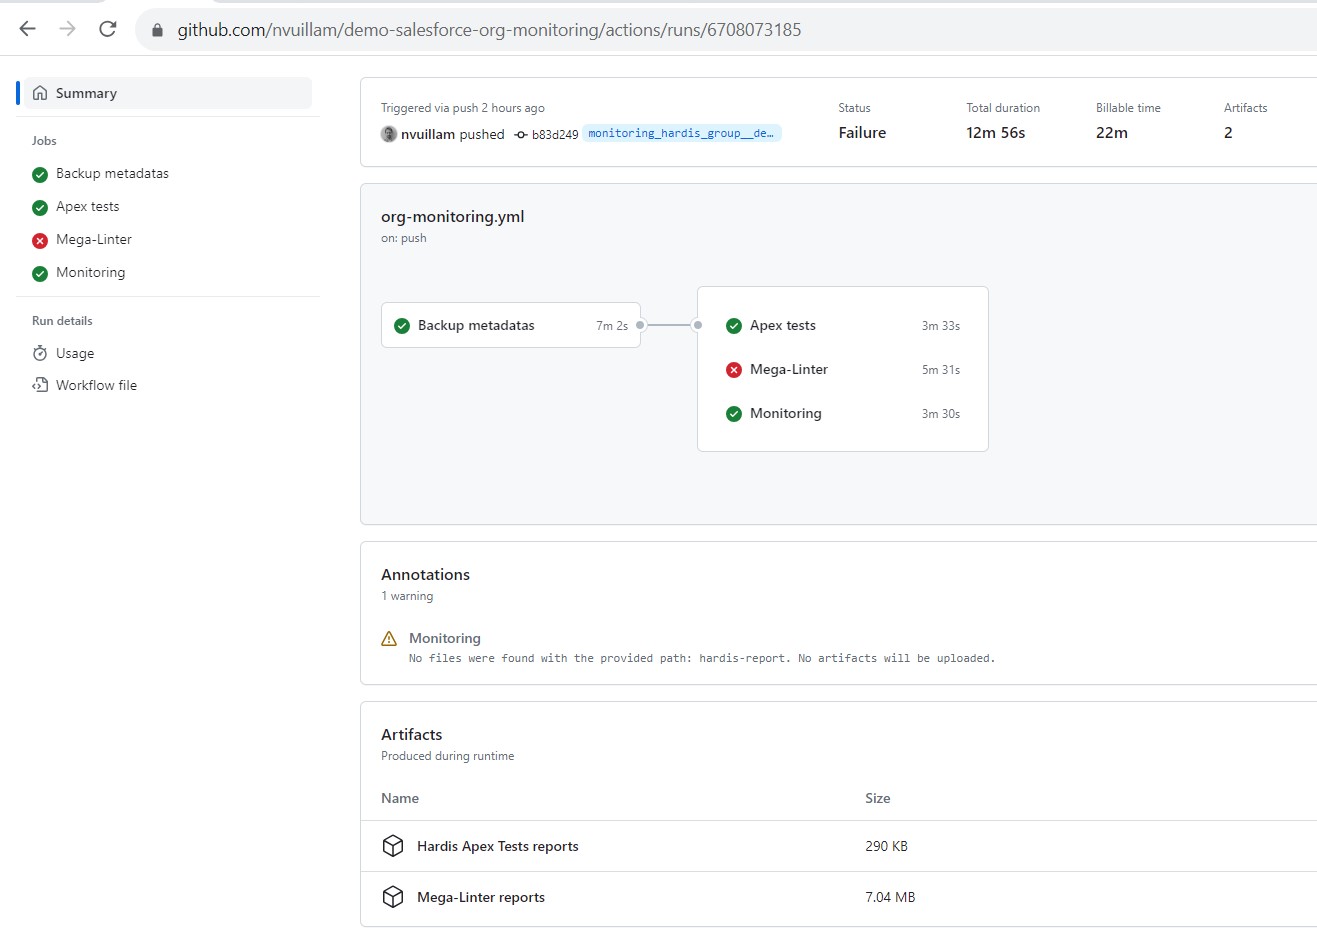
Every night (or on your own schedule), a CI job extracts all metadata from the org and pushes a new commit to the monitoring repository whenever something changed.
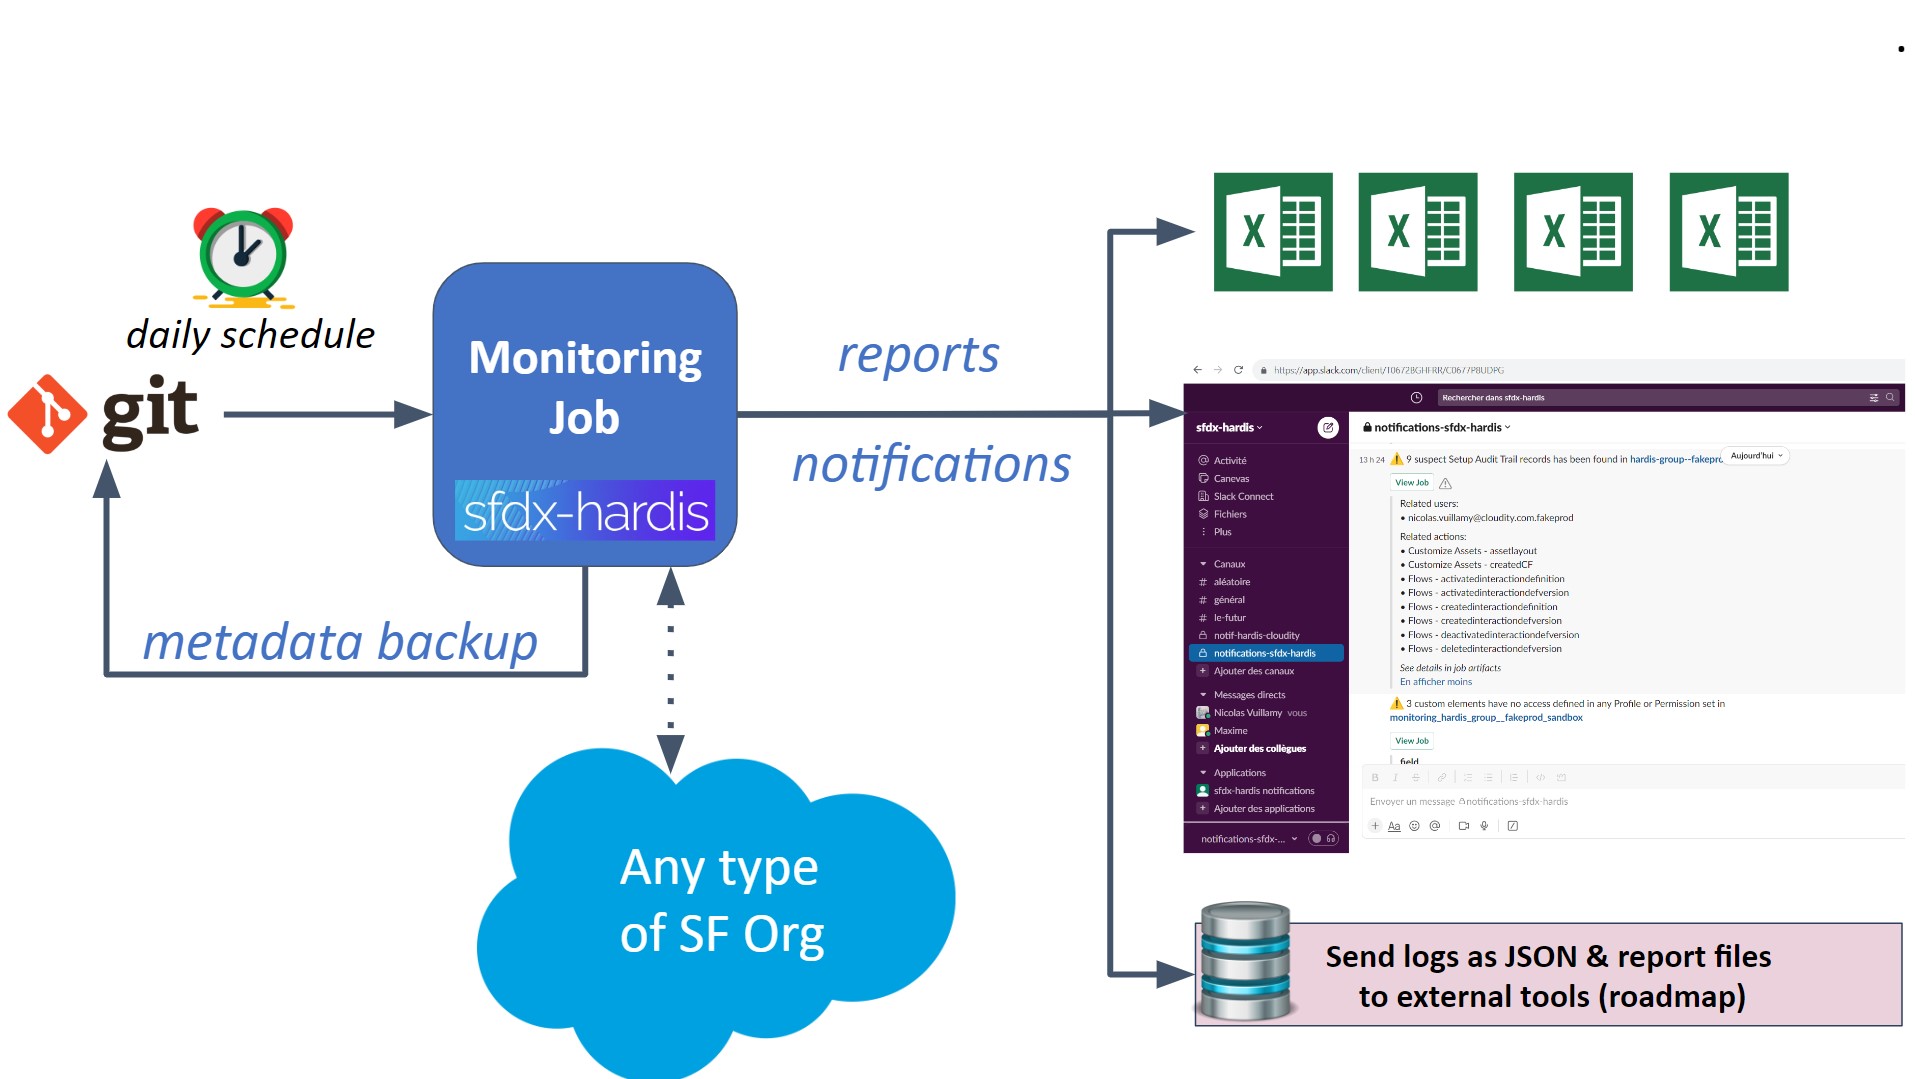
Additional jobs then run on top of the backup: Apex tests, code quality, legacy API checks, plus any custom command you define. Results are stored as job artifacts and forwarded to your notification channels.
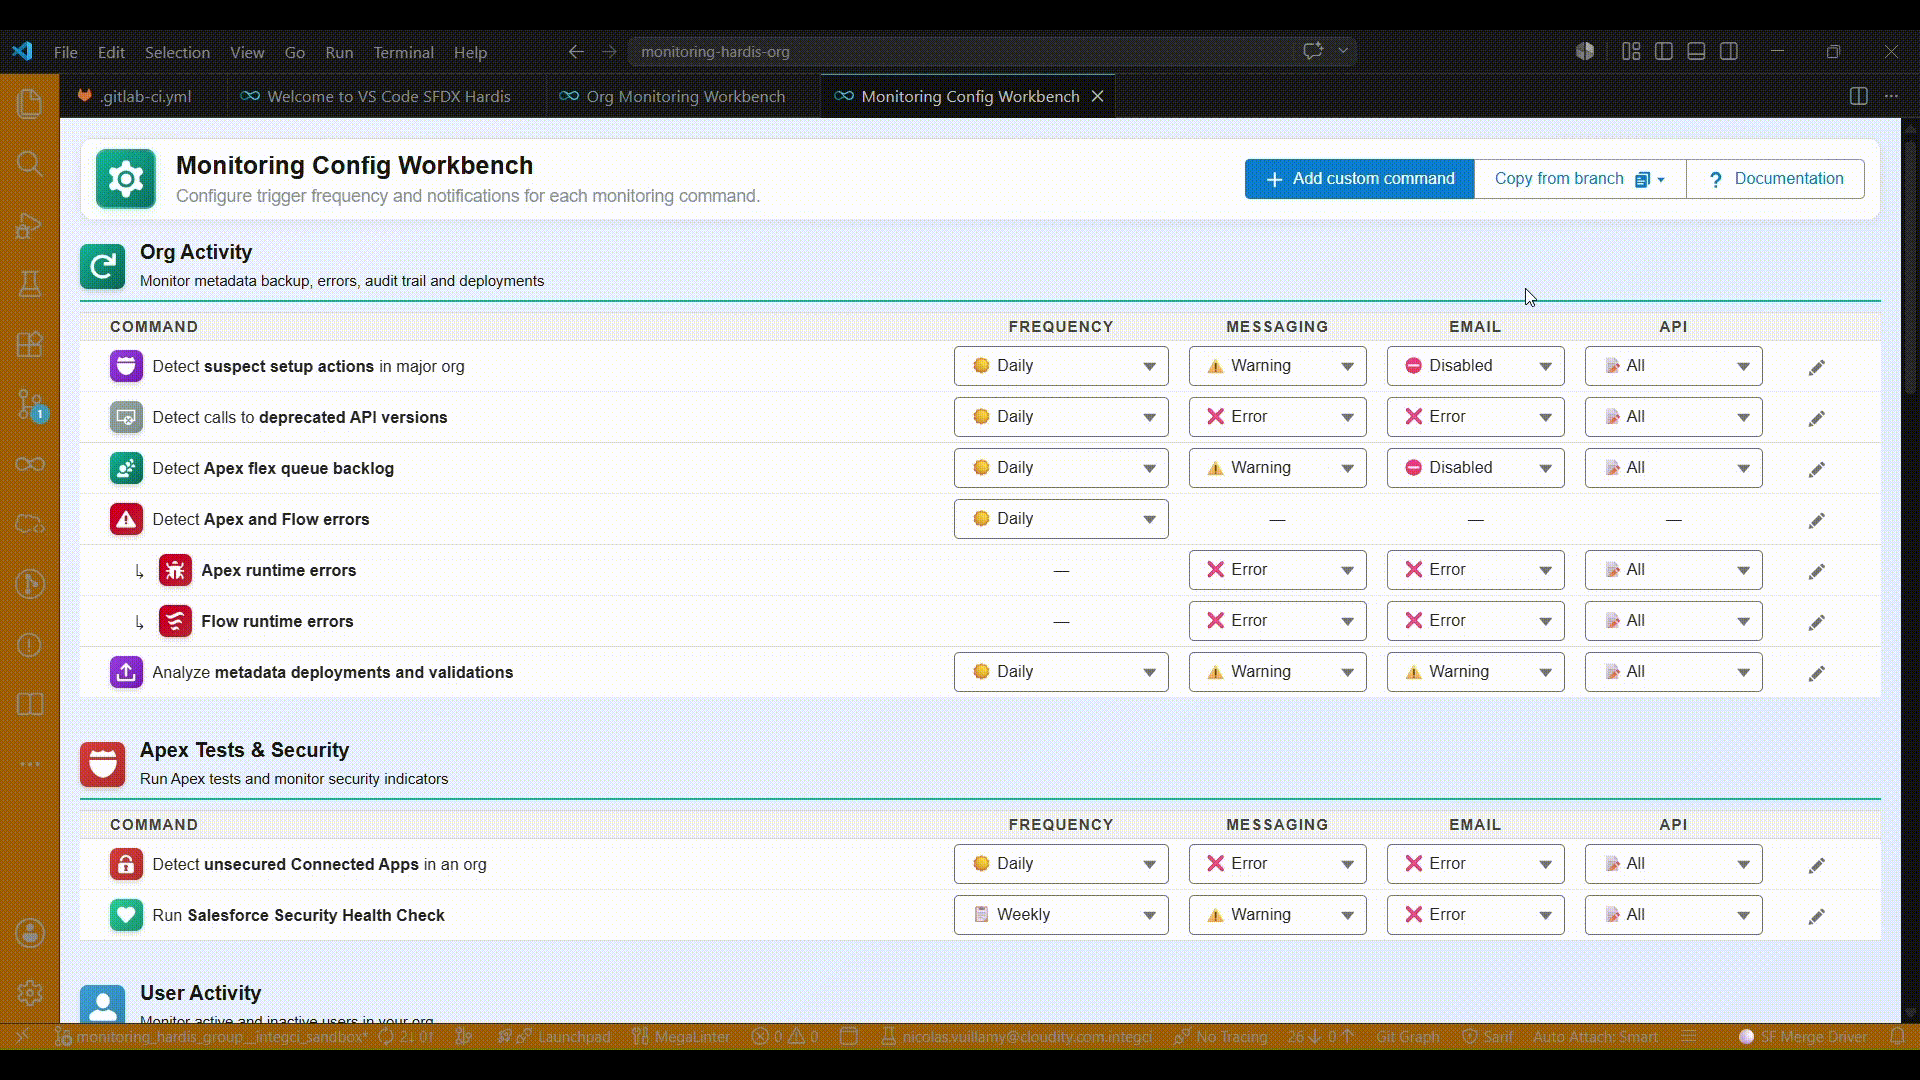
Route notifications anywhere
Each notification type (audit trail, org limits, Apex tests, ...) can be configured per channel with its own severity threshold. Configure it from the VS Code SFDX Hardis extension or directly in .sfdx-hardis.yml.
- Messaging channels: Slack and Microsoft Teams
- Email: any recipient list, with per-notification-type overrides
- API / Grafana / Prometheus: external endpoints for dashboards (e.g. Grafana Loki, Prometheus)
Customize the cadence
Most checks run daily; less critical ones run weekly (Saturday by default) to avoid overflowing your channels.
Every command is configurable in .sfdx-hardis.yml via the monitoringCommands property. Supported frequencies: daily, weekly, biweekly, monthly, off. Pick the day with frequencyDay (monday..sunday) or frequencyDayOfMonth (1..31). Pass --force-all to hardis:org:monitor:all (or set MONITORING_IGNORE_FREQUENCY=true) to run everything regardless of cadence.
See Monitoring configuration for full examples.
All monitoring commands
Next steps
- Configure monitoring on your orgs: step-by-step setup guide.
- Pair it with project documentation: regenerate docs automatically on every backup.
- Watch the Dreamforce 24 talk: live demo from San Francisco.
Dreamforce 24 presentation
Prefer reading? Here are the slides: