Org Monitoring by sfdx-hardis (Grafana Dashboards v2)
The v2 dashboard set builds on the metrics and logs that sfdx-hardis monitoring already sends to Grafana (setup guide).
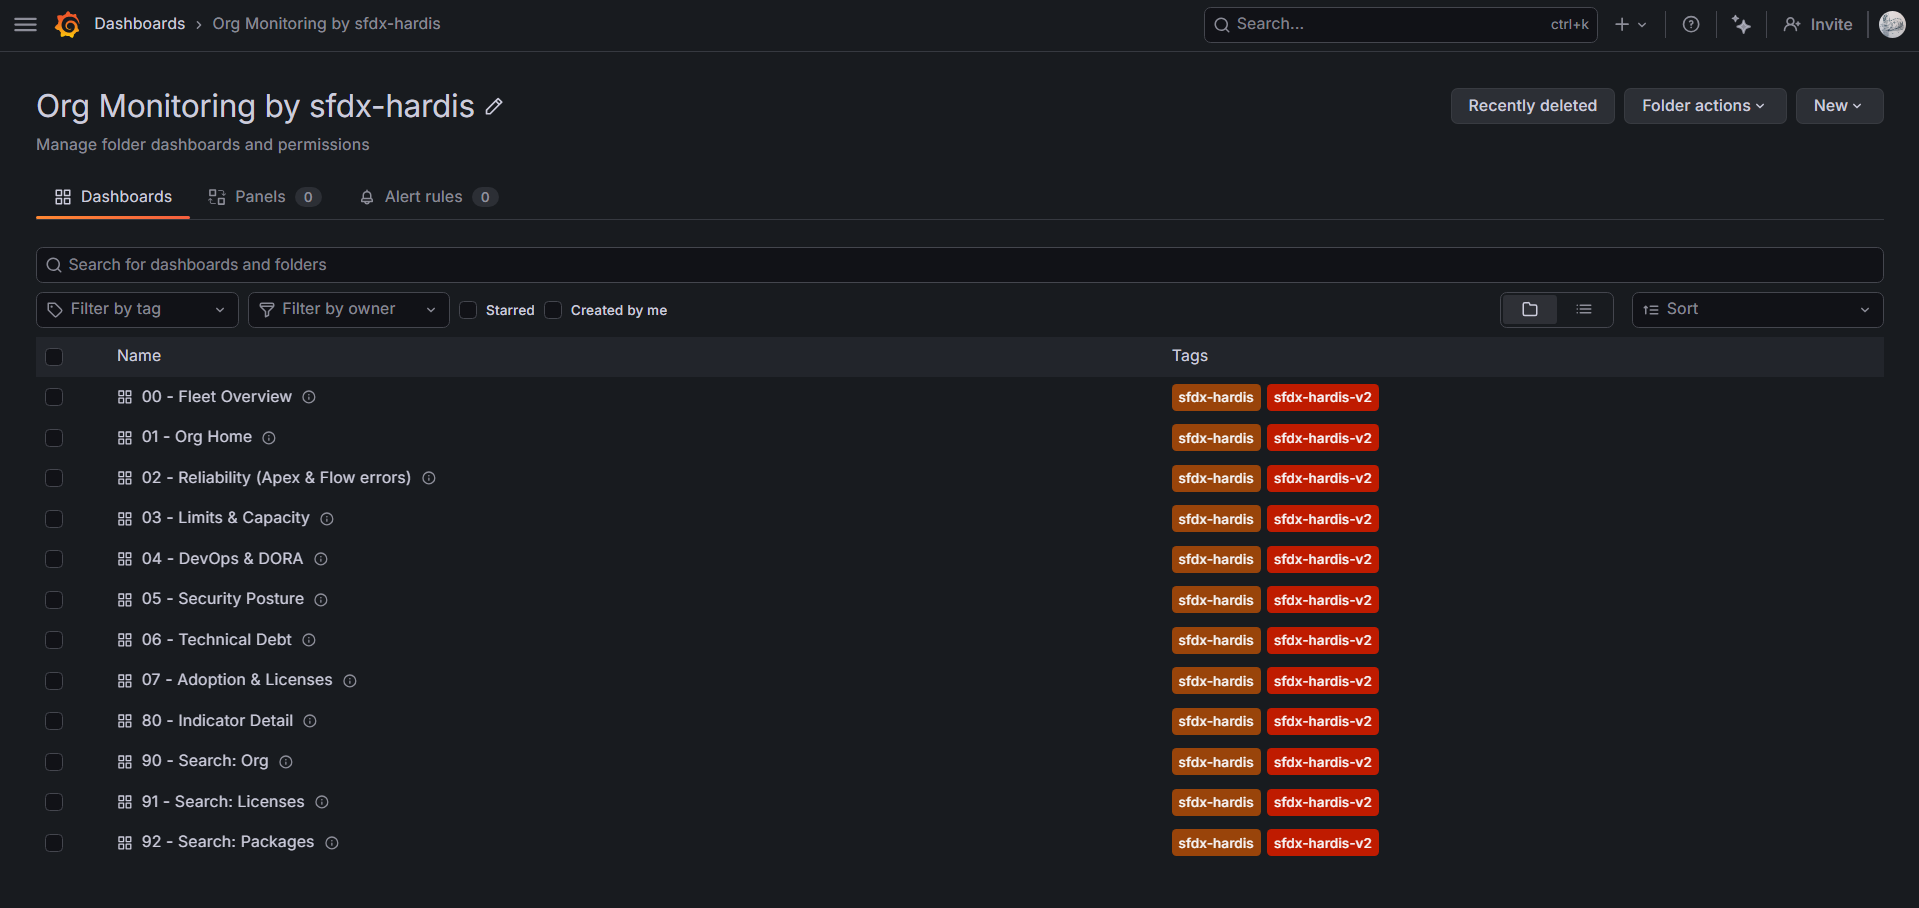
What it brings:
- A Fleet Overview showing every monitored org on one screen (health score, worst limit, errors, backups, freshness), with a Production/Sandbox filter
- Trends and averages on every indicator (7d/30d averages, week-over-week comparisons)
- Forecasts: projected date when each org limit or storage will be reached (30-day linear trend)
- A weekly org health score (0-100) with reliability / limits / security / tests / debt sub-scores
- DORA metrics panels (deployment frequency, lead time, change failure rate, MTTR, rework rate)
- Drill-down navigation: every number is clickable and leads to its detail view
- A ready-to-enable alert pack (shipped paused, so it costs nothing until you activate it)
- No personal data: combined with data anonymization, dashboards display counts, aggregates and pseudonyms, never readable usernames
The previous dashboard set is now legacy (v1). It keeps working (v2 uses its own folder, UIDs and files) but is frozen: new indicators and features only land in v2.
Prerequisites
- Monitoring configured with both endpoints of the API integration:
NOTIF_API_URL(Loki logs): detail tables, searches, freshness detectionNOTIF_API_METRICS_URL(Prometheus/Mimir metrics): trends, averages, forecasts
- A Grafana instance: Grafana Cloud (free tier works) or any self-hosted Grafana OSS/Enterprise (v10+)
- Some panels need a recent sfdx-hardis version on the monitoring pipeline (health score, impacted users, top failing Apex). They show an empty state until your monitoring jobs run with it.
Import the dashboards
The dashboards are instance-agnostic: no datasource UID is hardcoded. Each dashboard carries two hidden datasource variables (ds_prom, ds_loki) that resolve automatically to your Prometheus and Loki datasources: since sfdx-hardis data is sent to a single Prometheus and a single Loki, no picker is shown.
Automated install (recommended)
Run hardis:org:configure:grafana-dashboards:
sf hardis:org:configure:grafana-dashboards
The command asks for your Grafana instance URL and a service account token (Editor role; create one in Administration -> Users and access -> Service accounts), detects your Prometheus and Loki datasources, creates the Org Monitoring by sfdx-hardis folder and imports all the dashboards through the Grafana HTTP API. It works the same on Grafana Cloud and self-hosted instances.
Re-run the command after upgrading sfdx-hardis: dashboards are updated in place (stable uids, bookmarks and links keep working).
Non-interactive mode for CI and agents:
sf hardis:org:configure:grafana-dashboards --agent --grafana-url https://mycompany.grafana.net --grafana-token $GRAFANA_API_TOKEN
Manual import
- Download the JSON files from docs/grafana/dashboards-v2
- In Grafana, create a folder (suggested name:
Org Monitoring by sfdx-hardis) - Dashboards -> New -> Import -> upload each JSON file into that folder
If your instance has several Prometheus or Loki datasources and the automatic pick is wrong (Grafana Cloud internal datasources like alert state history are already filtered out), override it once per dashboard in Dashboard settings -> Variables, or pass ?var-ds_prom=<uid>&var-ds_loki=<uid> in the URL.
Self-hosted instances can also use file provisioning: copy the JSON files in your dashboards provisioning folder.
Navigation model
The dashboards form a tree. You rarely need the Grafana dashboard list: start from the Fleet Overview and click your way down.
flowchart TD
    FLEET["00 - Fleet Overview<br/>(all orgs)"] -->|click an org| HOME["01 - Org Home<br/>(one org)"]
    HOME -->|error numbers| REL["02 - Reliability"]
    HOME -->|limit gauges| LIM["03 - Limits & Capacity"]
    HOME -->|security numbers| SEC["05 - Security Posture"]
    HOME -->|coverage & tests| DEBT["06 - Technical Debt"]
    HOME -->|user numbers| ADO["07 - Adoption & Licenses"]
    HOME -->|consumption numbers| USAGE["08 - Usage & Cost"]
    HOME -->|other indicators| DTL["80 - Indicator Detail<br/>(any notification type)"]
    REL --> DTL
    LIM --> DTL
    SEC --> DTL
    DEBT --> DTL
    ADO --> DTL
    USAGE --> DTL
    DEVOPS["04 - DevOps & DORA"] --> DTL
    HOME -->|deployment numbers| DEVOPS
Rules used everywhere:
- Every number is clickable. Stats, gauges and table rows carry a data link to the matching detail: another dashboard, the generic Indicator Detail, or a full-screen table (e.g. the silent orgs list).
- Selections follow you. Links keep the current org, environment filter and datasources, so drilling down never resets your context.
- The Org Monitoring by sfdx-hardis dropdown (top of every dashboard) jumps to any other dashboard of the set.
The dashboards
00 - Fleet Overview
The entry point: all monitored orgs at a glance.
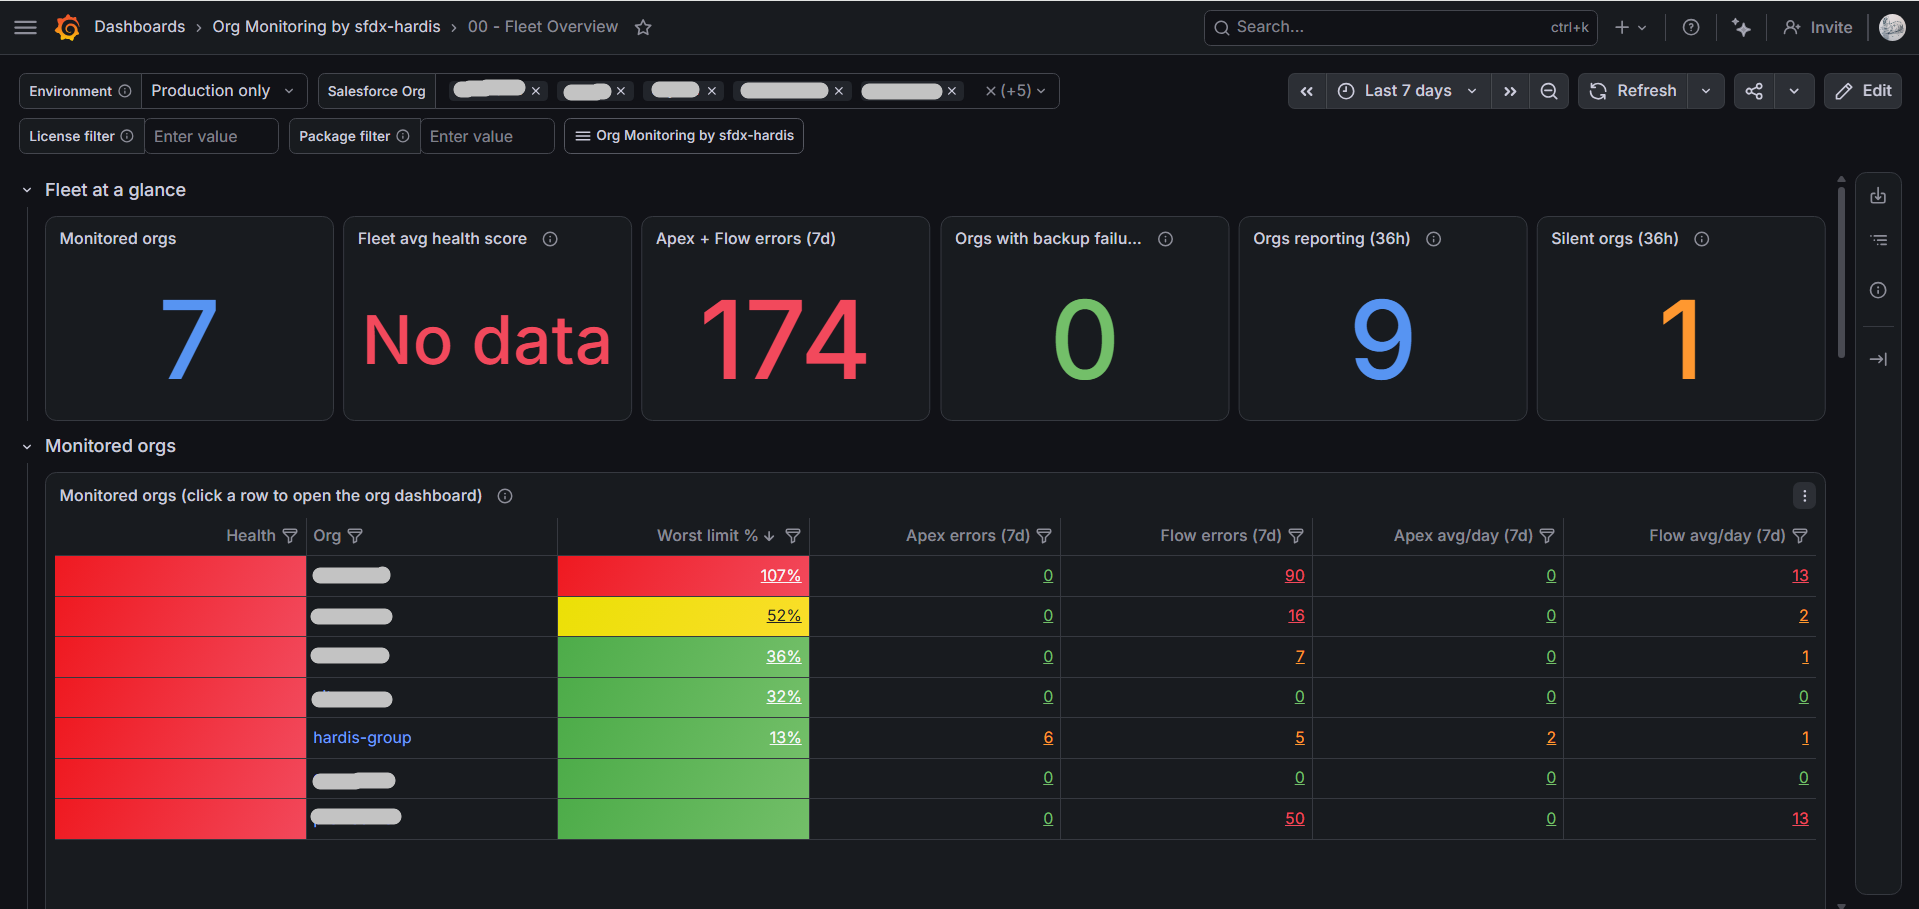
- Fleet at a glance: monitored orgs, fleet average health score, total errors (7d), orgs without backup for 36 hours, orgs reporting, silent orgs. Each stat opens its detail list.
- Environment filter: display all orgs, production only, or sandboxes only (sandboxes are recognized by their org identifier).
- Monitored orgs table: one row per org with health score, worst limit %, Apex/Flow errors (7d totals and daily averages). Click any cell to open the org's dashboard.
- Health sub-scores by org: the weekly composite score broken down (reliability, limits, security, tests, debt).
- Errors across the fleet: errors per day for all orgs, fleet-wide daily averages.
- Recent alerts and search: latest error/critical notifications (org, type, severity), plus license and package search criteria.
- Freshness and backups: silent orgs (no notification for 36h: the monitoring job probably failed), orgs reporting, orgs without a successful backup for 36h (the backup failed, or its job did not run).
01 - Org Home
Single-org overview, the hub for one org.
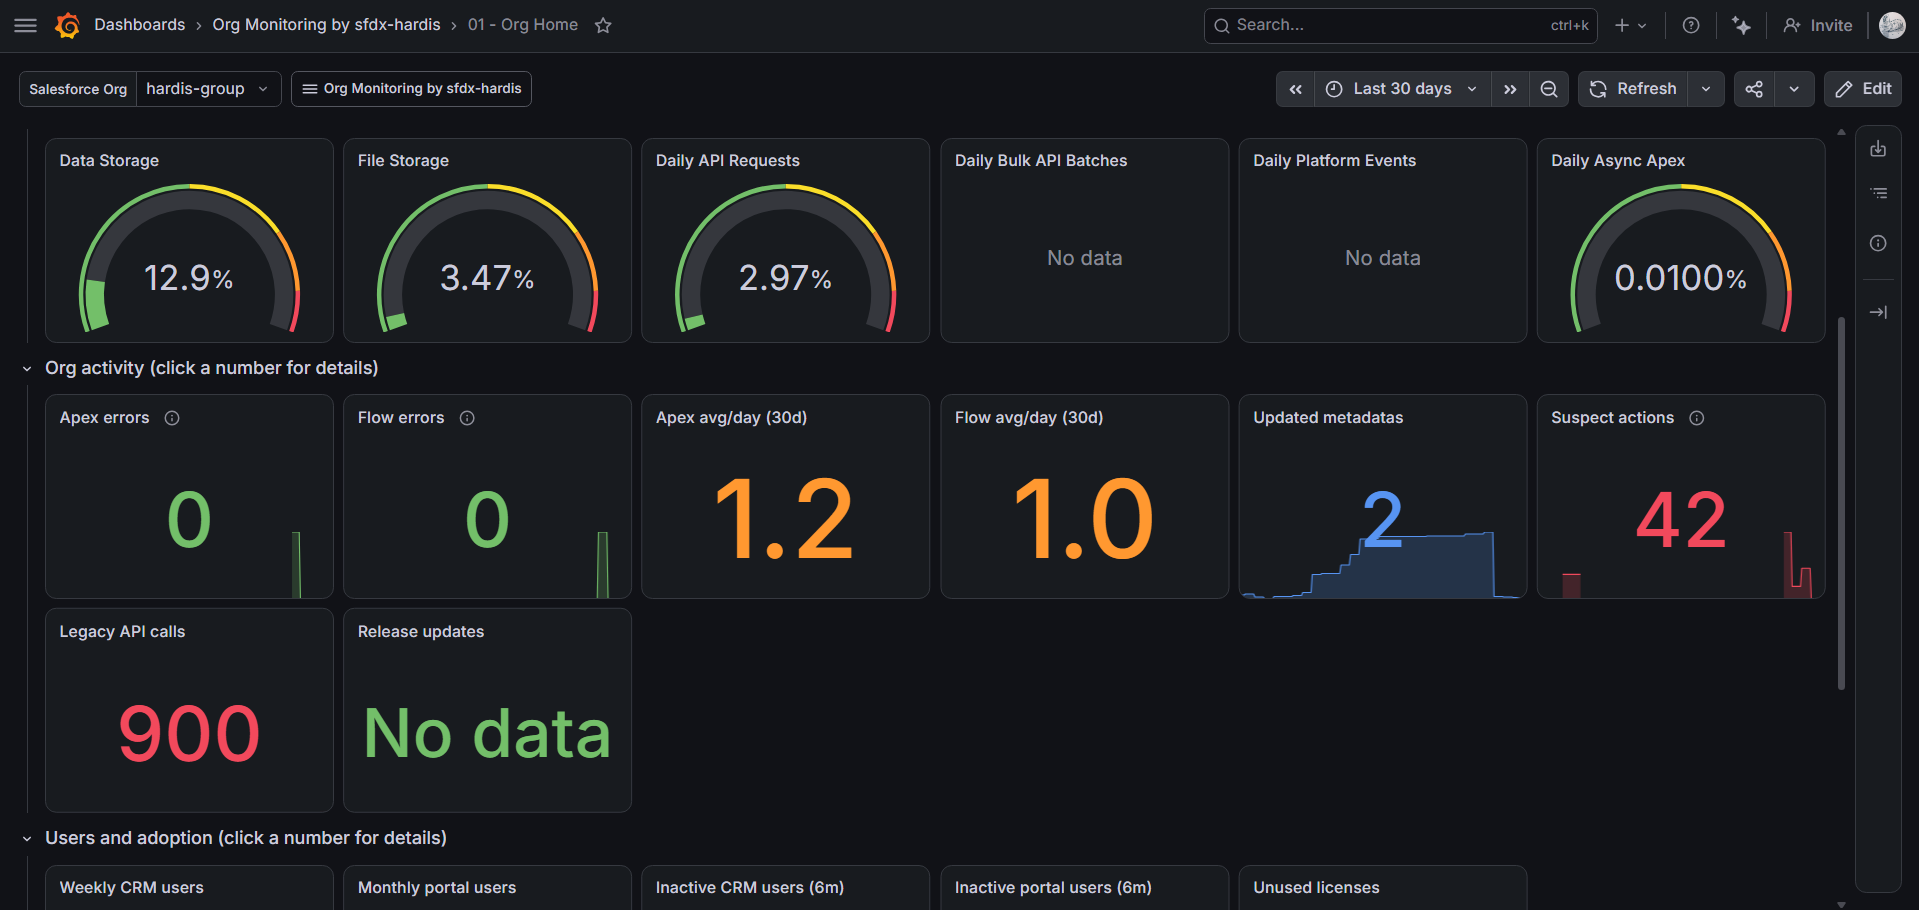
- Weekly health score with sub-scores bar gauge
- Org limits gauges (storage, API, bulk, platform events, async Apex): click to open Limits & Capacity
- Org activity: Apex/Flow errors (last run + 30d daily average), updated metadata, suspect setup actions, legacy API calls, release updates
- Users and adoption: active/inactive user counts
- Tests and security: Apex coverage, failing test classes, Security Health Check, unsecured Connected Apps, MFA bypass users
02 - Reliability (Apex & Flow errors)
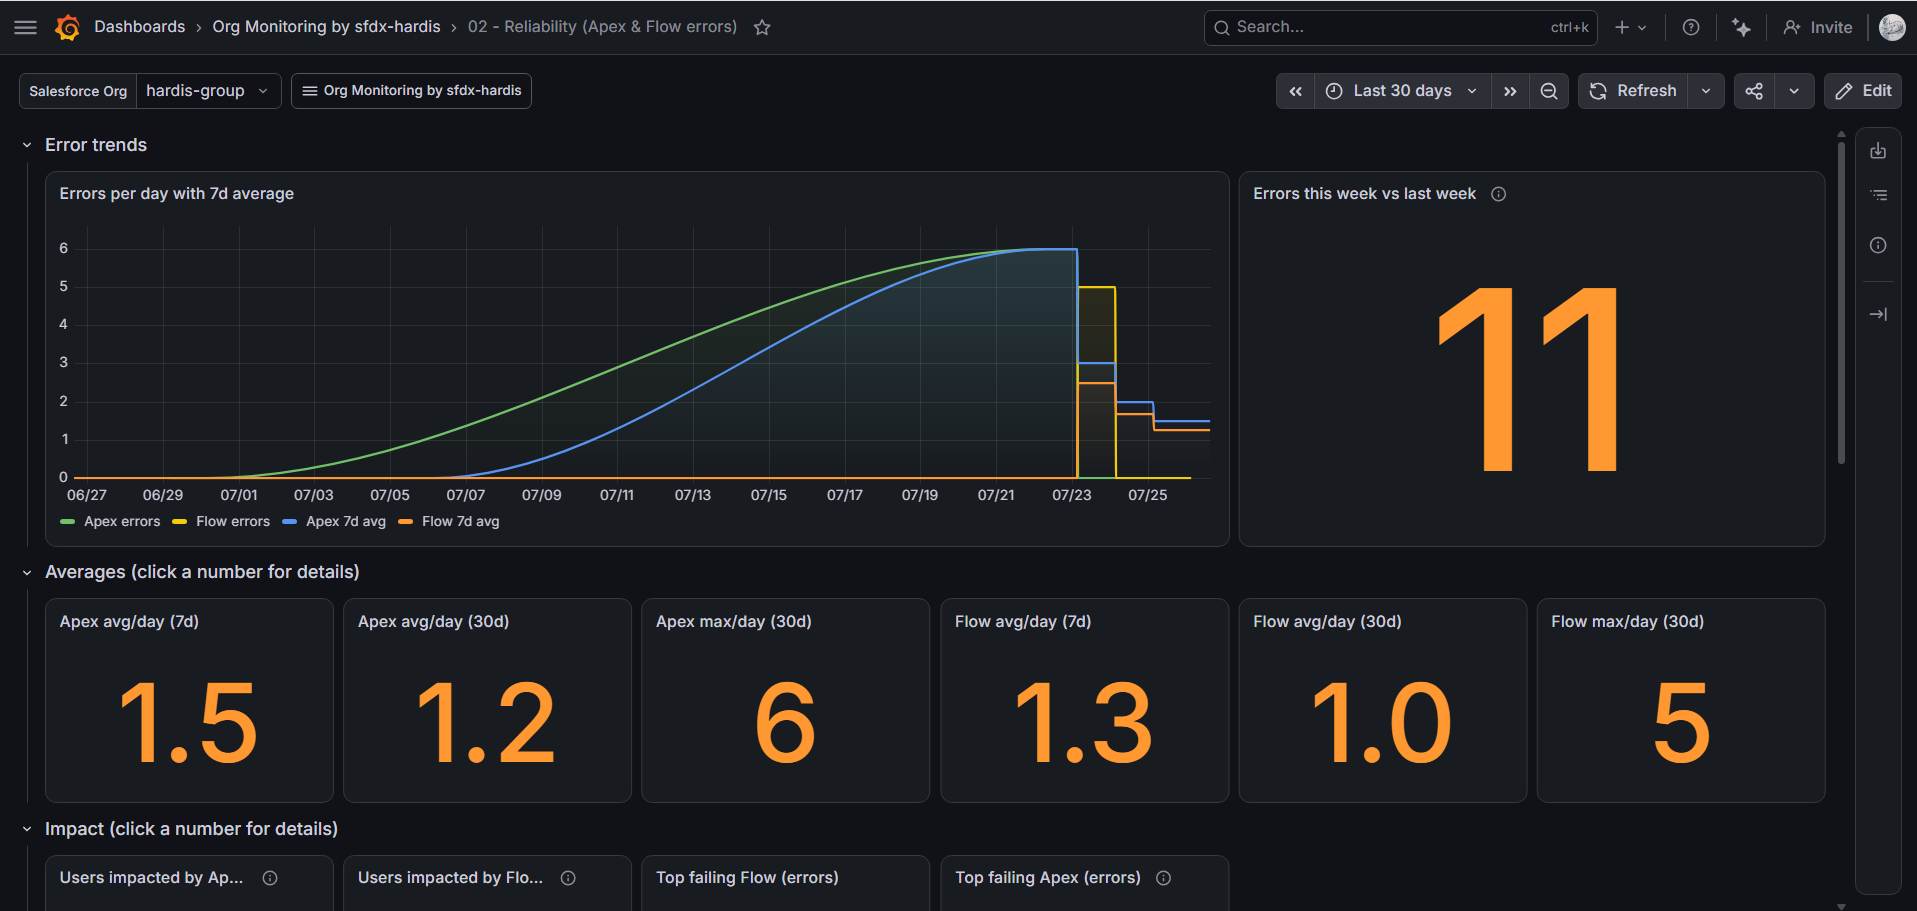
- Errors per day with 7-day average overlays, week-over-week comparison
- Averages row: avg/day over 7d and 30d, plus worst day (30d), for Apex and Flow errors
- Impact: distinct users hit by Apex/Flow errors
- Top failing automations: Flows, Flow steps, Apex classes ranked by error count
- Latest raw error rows (pseudonymized user identifiers)
03 - Limits & Capacity
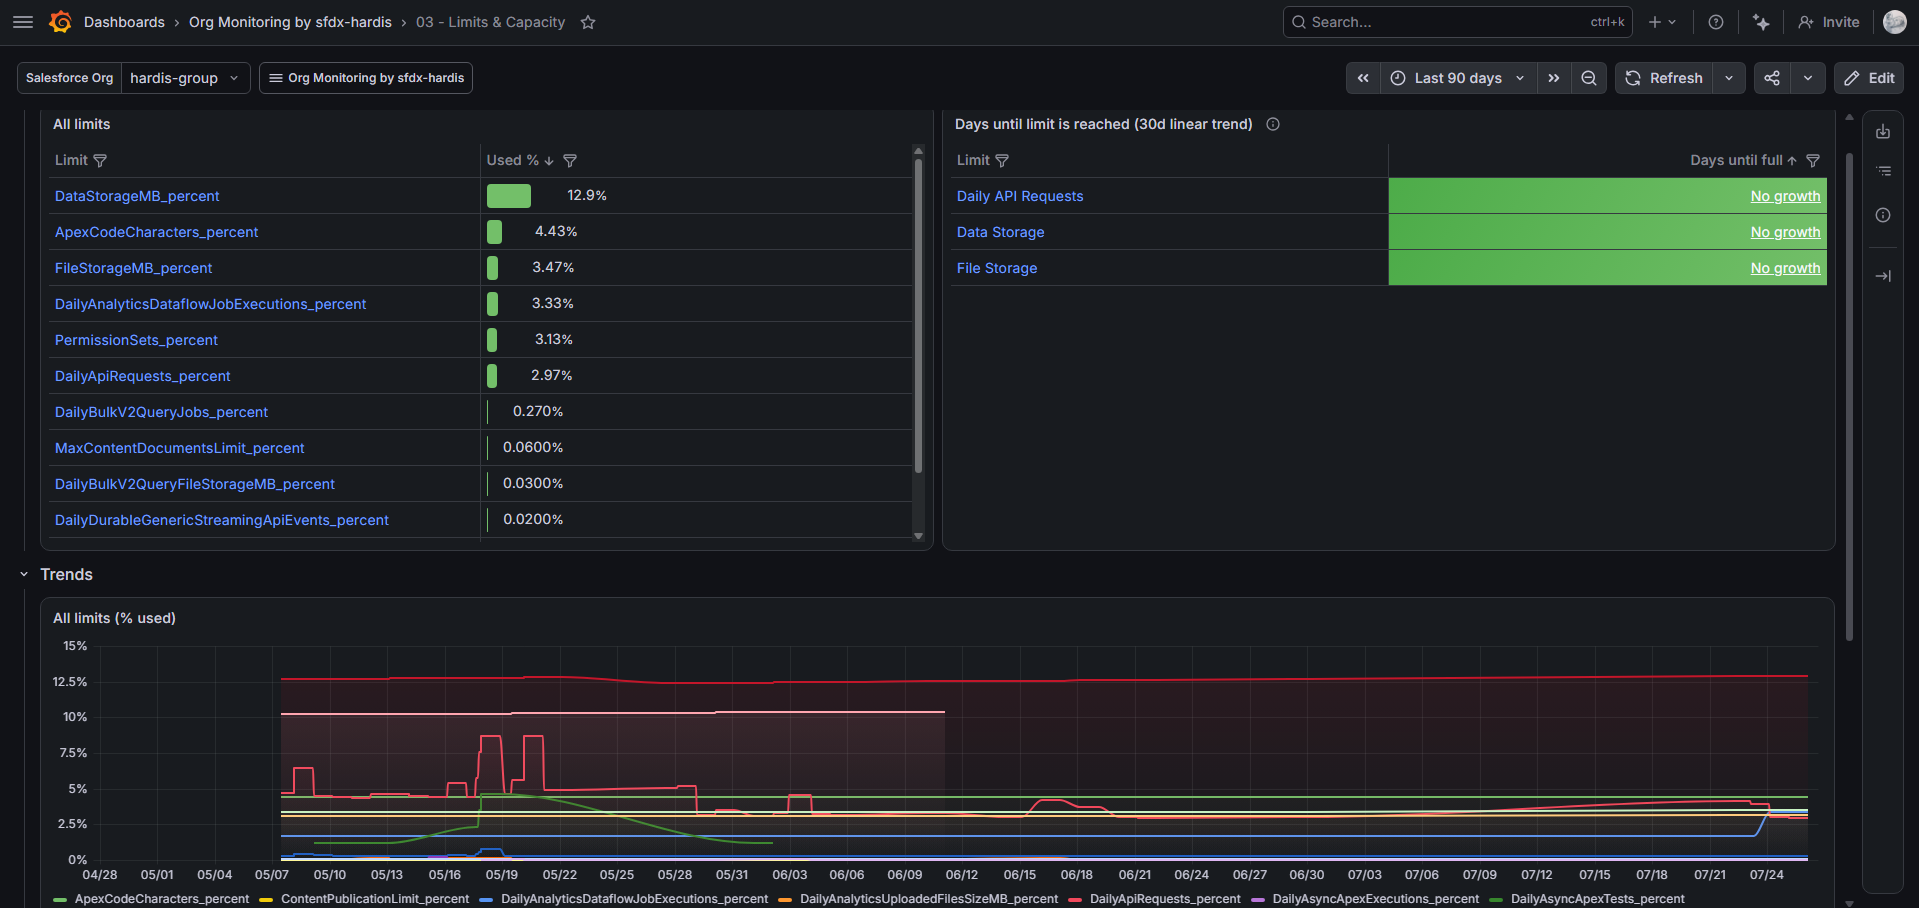
- All limits table with usage bars, sorted worst-first
- Days until limit is reached: 30-day linear regression per key limit, with "Limit exceeded" and "No growth" states
- 90-day trend for every limit percentage
- Storage focus: data and file storage gauges + evolution
04 - DevOps & DORA
- Deployment counts, success rates, average duration, validation success rate
- Deployments per week and per-deployment duration trends
- Deployment impact: how many components each deployment created, updated, deleted, or left untouched (a full deployment sends the whole package.xml, so the number of deployed items is the size of the project, not the size of the release)
- DORA metrics (deployment frequency, lead time, change failure rate, MTTR, rework rate): requires scheduling hardis:doc:dora-report, in the deployment pipeline or in the monitoring pipeline. See Send DORA metrics to Grafana
- Recent deployments list
05 - Security Posture
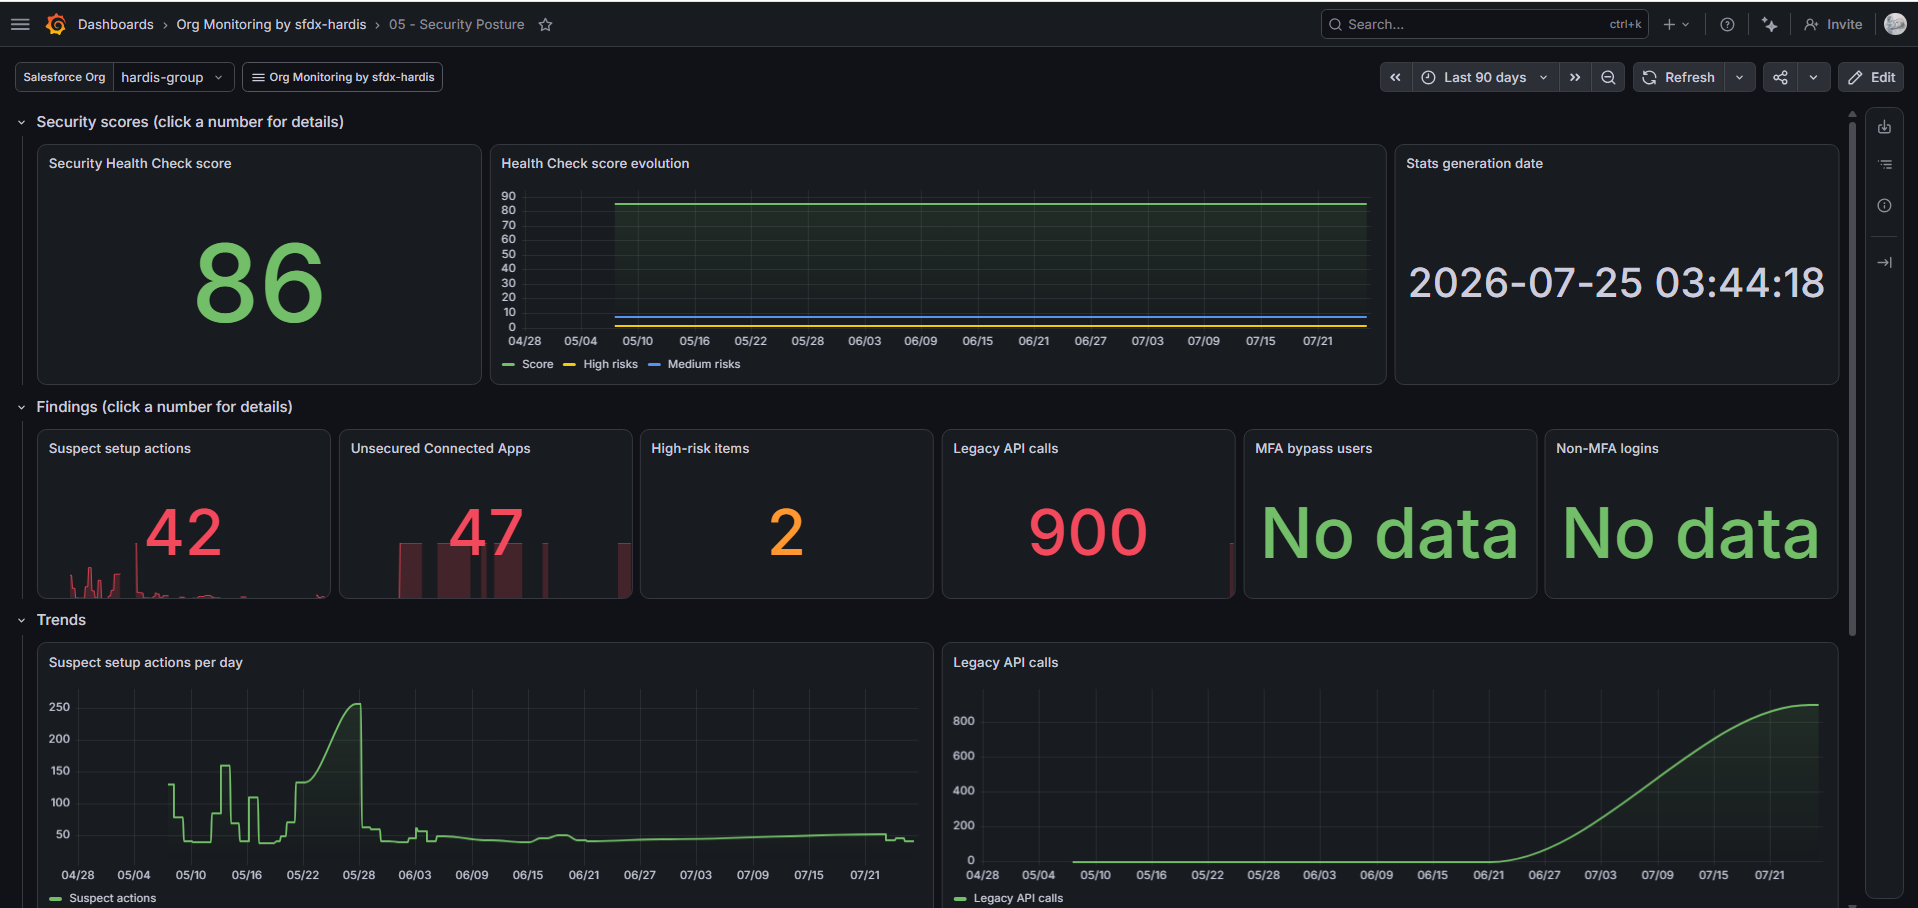
- Security Health Check score with evolution (score, high risks, medium risks)
- Findings: suspect setup actions, unsecured Connected Apps, high-risk items, legacy API calls, MFA bypass users, non-MFA logins
- Trends for suspect actions and legacy API calls
- Latest suspect audit trail entries (actor names stay readable: auditing setup actions requires knowing who did them)
06 - Technical Debt
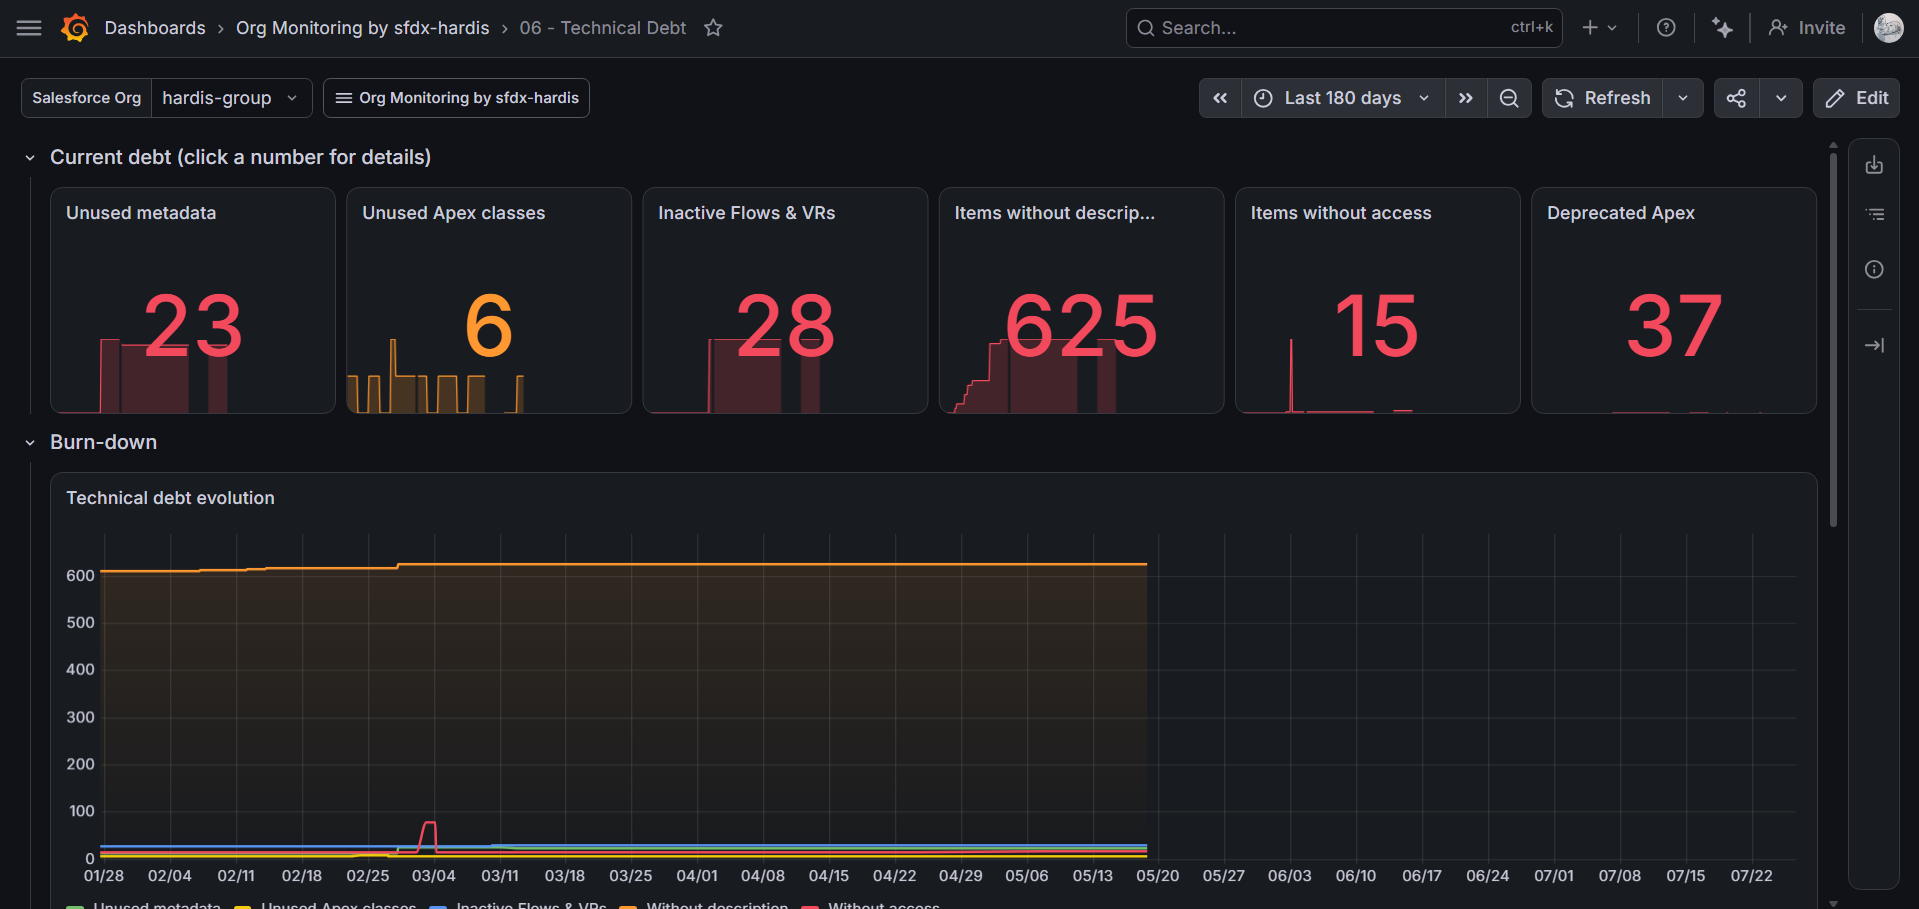
- Debt burn-down: unused metadata, unused Apex classes, inactive Flows & Validation Rules, missing descriptions, items without access, over 180 days
- Apex coverage evolution against the 75% threshold
- Permission set cleanup indicators
07 - Adoption & Licenses
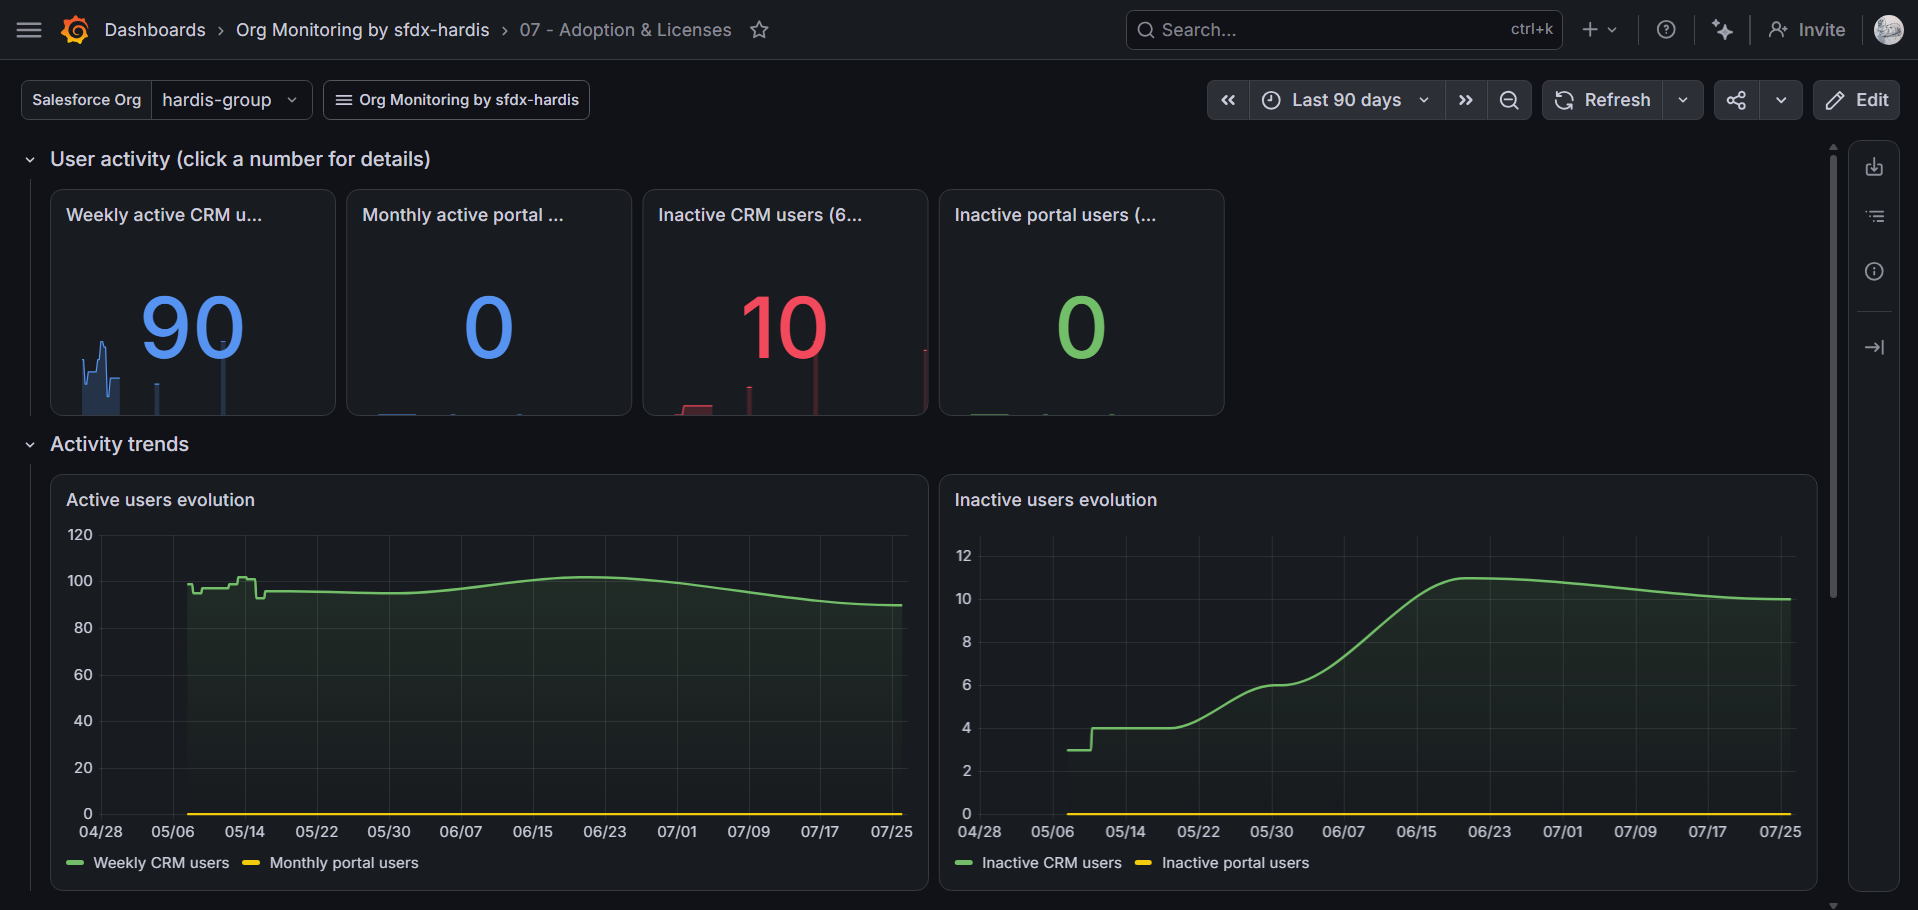
- Active CRM users (weekly) and portal users (monthly) with trends
- Inactive user counts (6 months)
- License usage table (used vs total per license)
08 - Usage & Cost
What Salesforce bills by consumption, as opposed to the throttling limits of 03 - Limits & Capacity.
- Over allowance: entitlements whose paid allowance is already fully consumed, so overage is accruing now. This is the number to act on, ahead of any forecast
- Worst consumption and entitlement consumption: share of each purchased allowance already used in the current billing period
- Projected consumption at period end: where consumption is heading, from the share consumed against the share of the period elapsed. Above 100% means the allowance is on track to be exceeded
- Cards in alert and highest alert: consumption cards for which Salesforce raised a utilization alert, counted per card rather than per threshold crossed
- Agentforce and Data 360 credits: total, metered and unmetered credits, action counts and their evolution (requires Data 360)
See usage-based entitlements, consumption utilization alerts and Agentforce and Data 360 credits.
80 - Indicator Detail
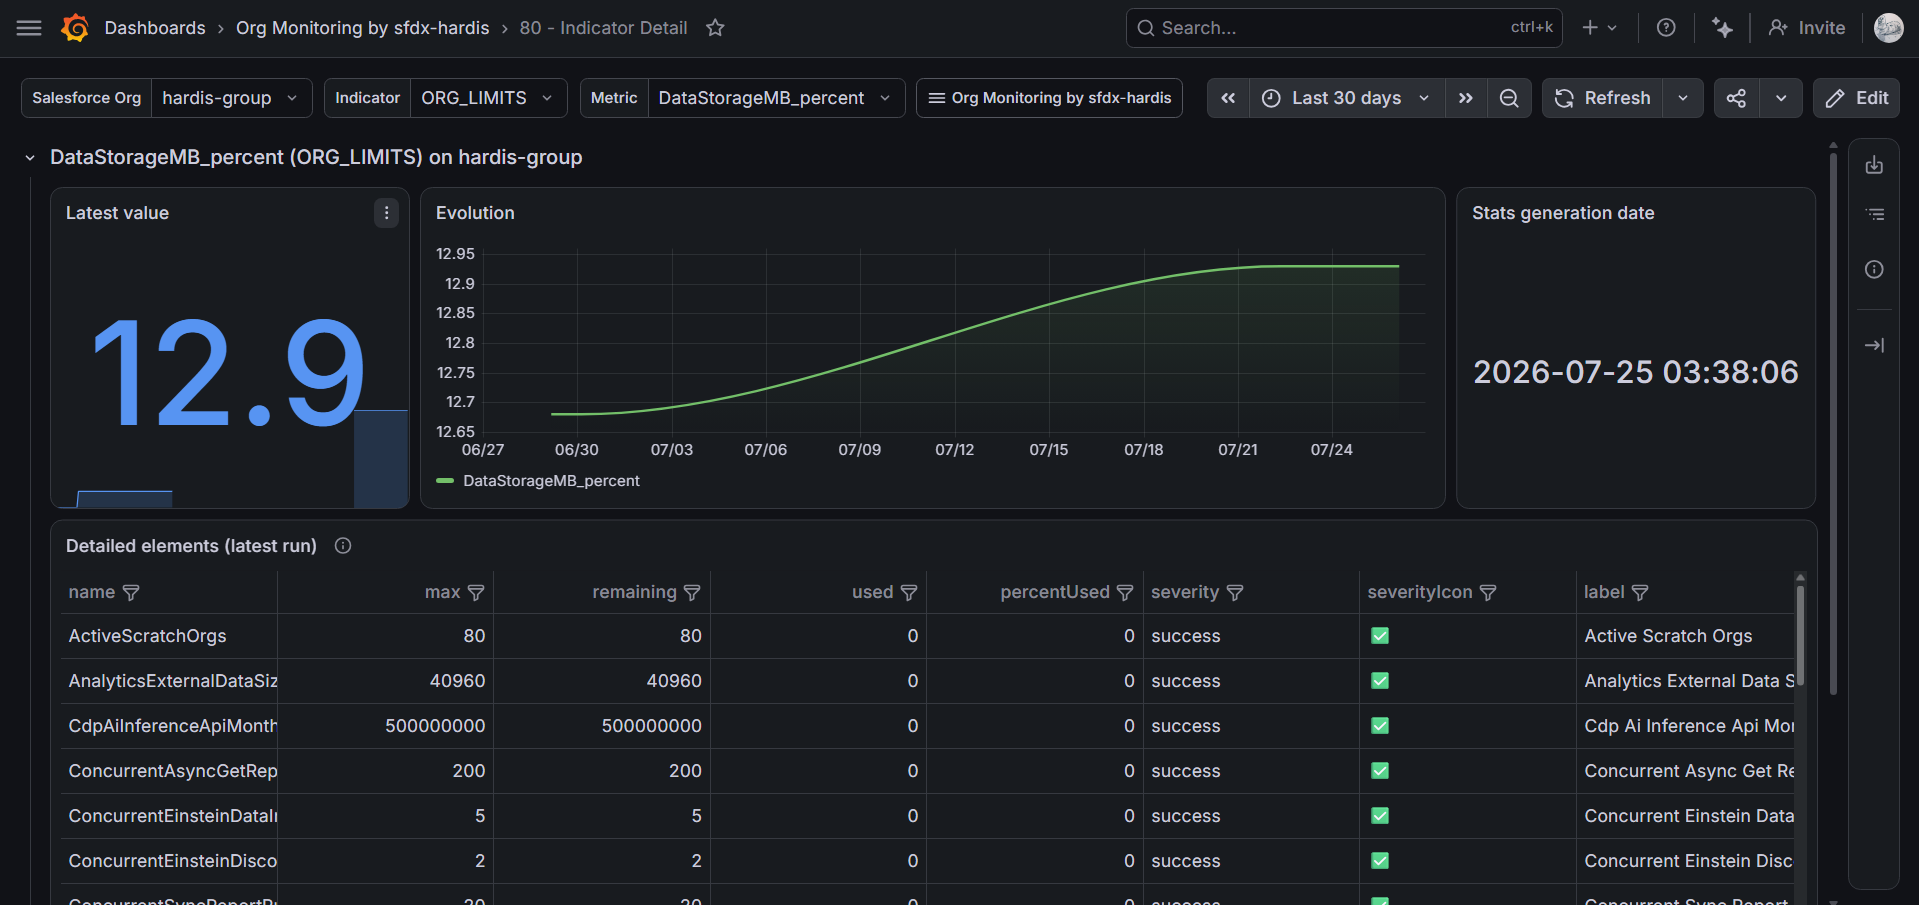
The generic drill-down: pick any org and any notification type, see the metric evolution and the detailed rows of the latest run. Every indicator lands here even when it has no dedicated panel.
90/91/92 - Search
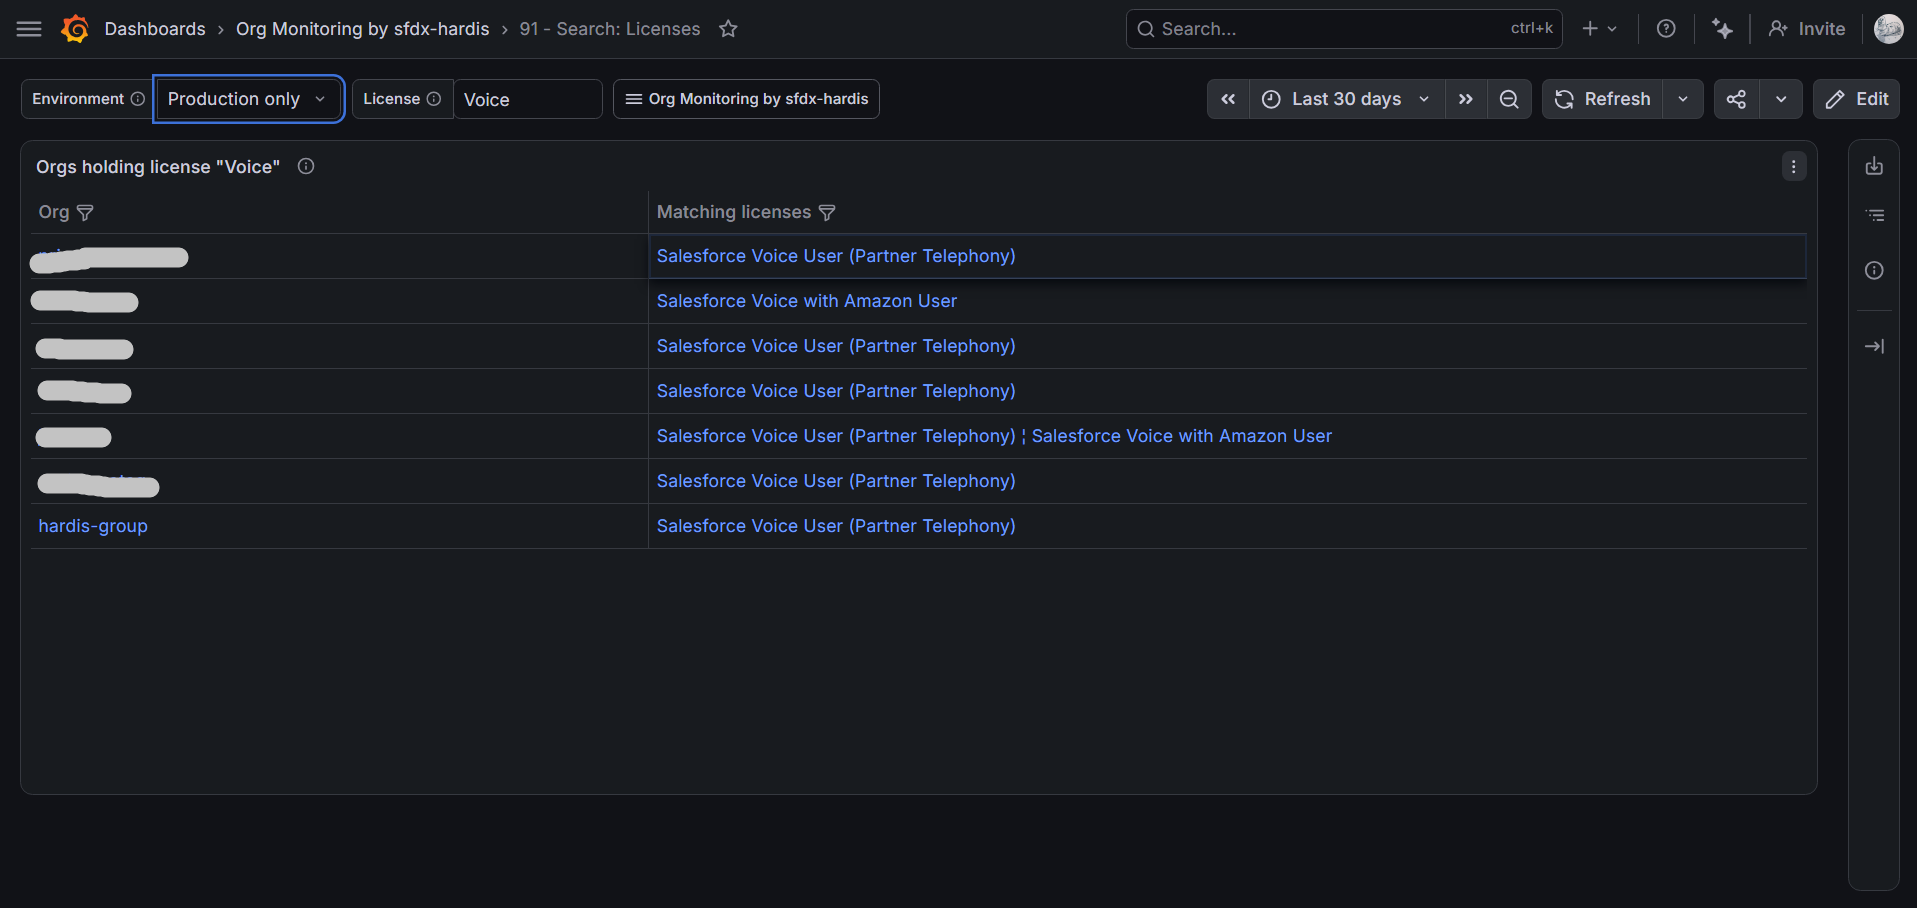
Find orgs across the fleet by identifier fragment, by held license, or by installed package. Results show what matched, not just the org list:
- Org search: organization name, Salesforce org id and country next to each matching org
- License search: the matching license names (e.g. searching
VoiceshowsSalesforce Voice User (Partner Telephony)); clicking a row opens the org's Adoption & Licenses dashboard - Package search: the matching package names with their installed version
Rows link to the relevant org dashboard.
The org health score
On weekly monitoring runs, hardis:org:monitor:all computes a composite score (0-100) from the run's collected notifications, with no extra Salesforce API call:
| Sub-score | Weight | Based on |
|---|---|---|
| Reliability | 30 | Apex + Flow error counts |
| Security | 25 | Security Health Check score, unsecured Connected Apps, suspect setup actions, legacy API calls, dangerous permissions |
| Limits | 20 | Worst org limit usage percentage |
| Tests | 15 | Apex coverage vs 75%, failing test classes |
| Technical debt | 10 | Unused metadata/Apex, inactive automations, missing descriptions, access gaps |
A sub-score is omitted (not counted as zero) when its source command did not run that week. A failed metadata backup caps the global score at 50: monitoring data is only trustworthy when the backup pipeline works.
Health score panels use an 8-day lookback so the weekly value displays all week.
The score travels with the MONITORING_SUMMARY notification, which reaches messaging/email channels only when an AI executive summary is generated (severity info). To receive the weekly score in Slack/Teams/email without AI, set the MONITORING_SUMMARY messaging threshold to log in your notificationConfig.
Data freshness and silent orgs
hardis:org:monitor:all always sends a MONITORING_SUMMARY notification at the end of each run, which doubles as a daily heartbeat per org. The plain heartbeat has severity log, so it only reaches observability backends: your Slack/Teams/email channels are not spammed daily (when an AI executive summary is generated, it is sent with severity info and reaches them). The Fleet Overview compares recent activity (36h) against the last 7 days to list orgs whose monitoring job stopped running: a silent org means broken monitoring, not a healthy org.
The summary also carries a ChannelsFailed metric: notification channel failures (expired Slack token, wrong email configuration...) are logged as warnings without failing the monitoring jobs, so chart or alert on ChannelsFailed_metric to detect them.
The same goes for the checks: a monitoring job that ran to its end is green even when its checks found issues or could not run. CommandsFailed_metric counts those checks: chart it, or alert on it, without watching the pipelines.
Import the alerts (optional)
The alert pack lives in docs/grafana/alerts-v2:
| Alert | Fires when |
|---|---|
| Salesforce org limit above 90% | Any limit of any org exceeds 90% usage |
| Salesforce storage projected full within 14 days | Data or File storage trends toward 100% (30-day linear regression) |
| Salesforce Apex/Flow error spike | Daily errors exceed twice the 7-day average |
| Salesforce metadata backup failed | A backup sent an error notification, or an org has no successful backup for 36 hours (its job did not run) |
| Salesforce org monitoring is silent | An org sent nothing for 36 hours (its monitoring job probably failed) |
| Salesforce org health score degraded | Score below 60, or dropped by more than 20 points |
| Salesforce usage-based entitlement over or projected over allowance | An entitlement has already consumed its full allowance, or is on track to exceed 150% of it before the period ends |
| Salesforce consumption card near its full allowance | A consumption card has passed 90% of its allowance |
All rules are paused by default (isPaused: true), so importing them triggers no evaluation and no cost on Grafana Cloud free tier.
Once imported, the rules appear in Alerting -> Alert rules (grouped under the dashboards folder), and in the Alert rules tab of the dashboards folder itself.
The easiest way to import them is the automated installer (the service account token then also needs alert provisioning permissions):
sf hardis:org:configure:grafana-dashboards --with-alerts
It substitutes the datasource placeholders with your datasource UIDs and imports every rule paused, editable from the Grafana UI.
To import manually:
- Replace the
${DS_PROMETHEUS}and${DS_LOKI}placeholders in the YAML with your datasource UIDs (found in Connections -> Data sources, in the datasource page URL) - Self-hosted: drop the file in your alerting provisioning folder. Grafana Cloud: import through the provisioning HTTP API or Terraform
Then, in both cases:
- In Alerting -> Alert rules, unpause the rules you want
- Configure your contact points and notification policies (Slack, email, ...)
Ask a coding agent
The same logs and metrics can answer questions asked to a coding agent (Claude Code, Codex, Gemini, Copilot...) opened in your monitoring repository, like "How did the API requests limit evolve this quarter?". Set grafanaUrl in the .sfdx-hardis.yml of the monitoring branches (and optionally grafanaLokiDatasourceUid and grafanaPrometheusDatasourceUid), and give the agent a service account token with the Viewer role as GRAFANA_API_TOKEN in a .env file. The AGENTS.md written by each backup tells the agent how to query them, read-only. See Ask questions with a coding agent.
sf hardis:org:configure:grafana-dashboards also reads grafanaUrl when neither --grafana-url nor GRAFANA_API_URL is set.
Privacy
Dashboards only display aggregates, counts, and (for detail tables) the pseudonymized identifiers produced by data anonymization, which is enabled by default in CI: user_<hash> for usernames, emails and display names, id_<hash> for user record Ids, ip_<hash> for client IPs. At the default standard level, setup audit trail actors stay readable on purpose (auditing setup actions requires knowing who did them); the strict level pseudonymizes them too.
Troubleshooting
| Symptom | Likely cause |
|---|---|
| Everything shows "No data" | NOTIF_API_METRICS_URL not configured (Prometheus feeds all trend/average panels), or the datasource variables resolved to the wrong datasource (see Import the dashboards) |
| Detail tables are empty but stats show values | NOTIF_API_URL (Loki) not configured, or logs skipped via NOTIF_API_SKIP_LOGS |
| Health score, impacted users, or top failing Apex panels are empty | The monitoring pipeline runs an older sfdx-hardis version: these panels need recently added metrics |
| Health score panel empty on some days | Normal: the score is computed on weekly runs only, and panels look back 8 days |
| DORA panels show "Schedule dora-report" | hardis:doc:dora-report ran in neither the deployment pipeline nor the monitoring pipeline in the last 35 days, or it failed: it needs a git provider token that can read the CI jobs of the deployment repository |
| Indicator Detail shows the graph and value but no detail rows | Detail rows come from Loki logs (~30 days retention on Grafana Cloud) while metrics keep 13 months: the last run of that indicator is older than the logs retention. Fix the monitoring job so the command runs again |
| An org appears twice or values look doubled | Not expected in v2 (queries aggregate per org); check that two different monitoring repos are not both pushing with different SFDX_HARDIS_MONITORING_KEY values for the same org |
| Old entries still show readable usernames | Anonymization only applies to new entries; older ones keep their values until logs retention expires |
Contributing
The JSON files are generated: edit generator.mjs (same folder), run node generator.mjs, then npx mocha "test/grafana-dashboards-v2.test.ts". The test suite enforces the portability rules (no hardcoded datasource, daily-sample lookback wrappers, detail links on every number).
Learn by doing
The free Salesforce DevOps with sfdx-hardis course does this, click by click, on an org of your own: